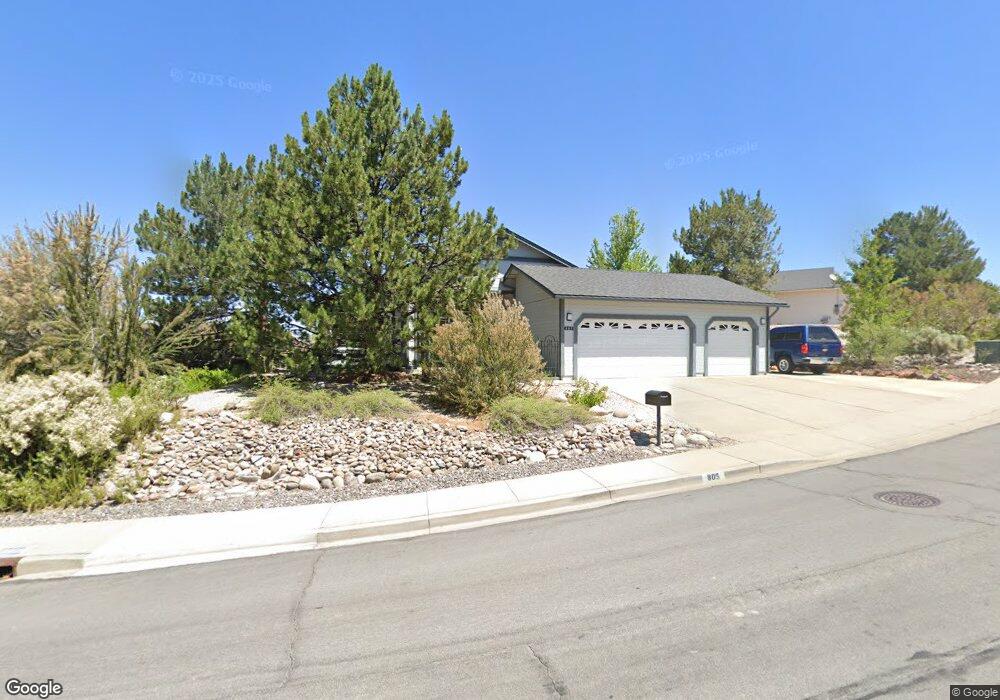
805 N University Park Loop Reno, NV 89512
West University NeighborhoodEstimated Value: $553,000 - $643,000
3
Beds
2
Baths
1,606
Sq Ft
$370/Sq Ft
Est. Value
About This Home
This home is located at 805 N University Park Loop, Reno, NV 89512 and is currently estimated at $593,430, approximately $369 per square foot. 805 N University Park Loop is a home located in Washoe County with nearby schools including Peavine Elementary School, Archie Clayton Pre-AP Academy, and Coral Academy Charter School Elementary.
Ownership History
Date
Name
Owned For
Owner Type
Purchase Details
Closed on
Jan 8, 2020
Sold by
Worley Jolynn
Bought by
Worley Jolynn and Jolynn Worley Trust
Current Estimated Value
Purchase Details
Closed on
Oct 17, 2017
Sold by
Worley Jolynn and Christensen Mitchell L
Bought by
Worley Jolynn
Purchase Details
Closed on
Mar 23, 2005
Sold by
Christensen Edgar Lyle and Christensen Mary
Bought by
Christensen Edgar Lyle and Christensen Mary
Purchase Details
Closed on
Sep 20, 1999
Sold by
Worley David K and Worley Lo Lynn C
Bought by
Christensen Edgar Lyle and Christensen Mary B
Purchase Details
Closed on
Oct 20, 1995
Sold by
Hickman Willis and Hickman Patricia A
Bought by
Worley David K and Worley Jo Lynn C
Home Financials for this Owner
Home Financials are based on the most recent Mortgage that was taken out on this home.
Original Mortgage
$134,000
Interest Rate
7.67%
Create a Home Valuation Report for This Property
The Home Valuation Report is an in-depth analysis detailing your home's value as well as a comparison with similar homes in the area
Home Values in the Area
Average Home Value in this Area
Purchase History
| Date | Buyer | Sale Price | Title Company |
|---|---|---|---|
| Worley Jolynn | -- | None Available | |
| Worley Jolynn | -- | None Available | |
| Christensen Edgar Lyle | -- | -- | |
| Christensen Edgar Lyle | $180,000 | Western Title Inc | |
| Worley David K | $167,500 | Stewart Title |
Source: Public Records
Mortgage History
| Date | Status | Borrower | Loan Amount |
|---|---|---|---|
| Previous Owner | Worley David K | $134,000 |
Source: Public Records
Tax History Compared to Growth
Tax History
| Year | Tax Paid | Tax Assessment Tax Assessment Total Assessment is a certain percentage of the fair market value that is determined by local assessors to be the total taxable value of land and additions on the property. | Land | Improvement |
|---|---|---|---|---|
| 2026 | $1,140 | $98,510 | $44,555 | $53,955 |
| 2025 | $2,221 | $99,746 | $44,555 | $55,191 |
| 2024 | $2,221 | $97,848 | $42,000 | $55,848 |
| 2023 | $1,538 | $93,702 | $41,545 | $52,157 |
| 2022 | $2,059 | $85,769 | $42,035 | $43,734 |
| 2021 | $1,999 | $68,918 | $25,200 | $43,718 |
| 2020 | $1,939 | $71,334 | $27,300 | $44,034 |
| 2019 | $1,882 | $68,996 | $26,250 | $42,746 |
| 2018 | $1,828 | $64,776 | $22,750 | $42,026 |
| 2017 | $1,775 | $60,577 | $18,375 | $42,202 |
| 2016 | $1,730 | $60,387 | $17,150 | $43,237 |
| 2015 | $1,728 | $59,113 | $15,750 | $43,363 |
| 2014 | $1,674 | $54,138 | $12,215 | $41,923 |
| 2013 | -- | $44,236 | $9,030 | $35,206 |
Source: Public Records
Map
Nearby Homes
- 3510 Comstock Dr
- 3621 Pimlico St
- 3566 Penn National Dr
- 3656 Ruidoso St
- 3715 Coastal St
- 1080 S University Park Loop
- 1120 University Park Ct
- 1172 Arrastra Rd
- 1176 Arrastra Rd Unit Lot 16
- 1160 Arrastra Rd
- 200 Talus Way Unit 123
- 200 Talus Way Unit 232
- 200 Talus Way Unit 522
- 140 Griswold Way Unit C
- 230 Bisset Ct Unit B
- 2528 Comstock Dr
- 970 Demos Ct
- 18 Colombard Way
- 27 Chianti Way
- 29 Chianti Way
- 815 N University Park Loop
- 3540 Socrates Dr
- 3510 Socrates Dr
- 825 N University Park Loop
- 3550 Socrates Dr
- 3465 Socrates Dr
- 3485 University Green Dr
- 3475 Socrates Dr
- 3455 Socrates Dr
- 3500 Socrates Dr Unit 2
- 790 Sienna Station Way
- 835 N University Park Loop
- 3475 University Green Dr
- 3560 Socrates Dr
- 3490 Socrates Dr
- 780 Sienna Station Way
- 846 N University Park Loop
- 3570 Socrates Dr
- 845 N University Park Loop
- 3675 Sienna Summit Ct