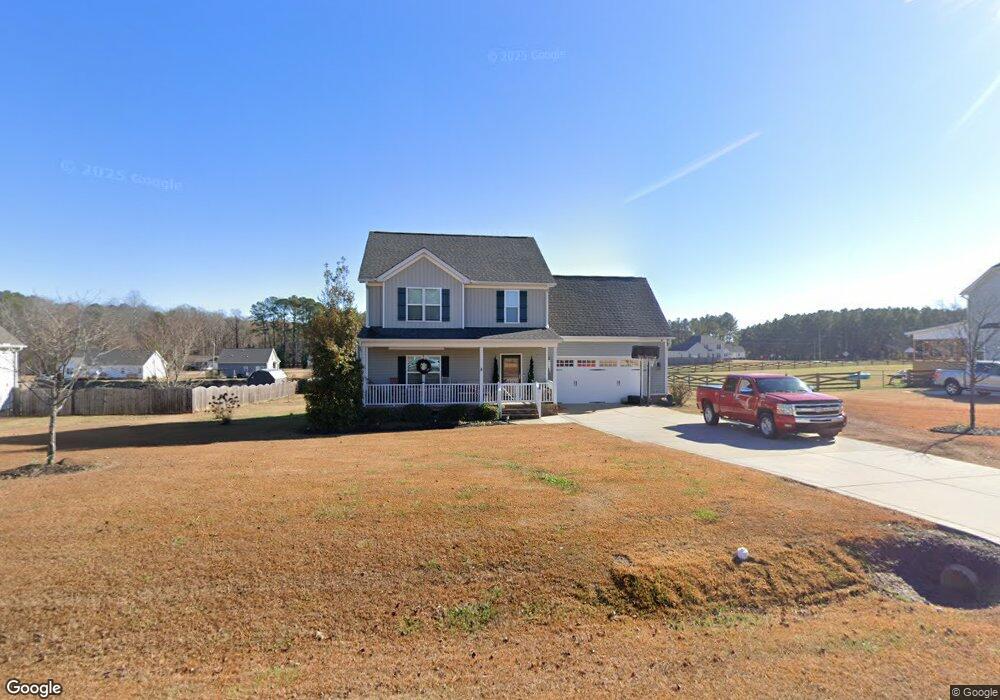
8059 Creech Rd Middlesex, NC 27557
Estimated Value: $331,802 - $393,000
3
Beds
3
Baths
1,864
Sq Ft
$193/Sq Ft
Est. Value
About This Home
This home is located at 8059 Creech Rd, Middlesex, NC 27557 and is currently estimated at $359,451, approximately $192 per square foot. 8059 Creech Rd is a home located in Nash County with nearby schools including Middlesex Elementary School, Southern Nash Middle School, and Southern Nash High School.
Ownership History
Date
Name
Owned For
Owner Type
Purchase Details
Closed on
Jul 5, 2016
Sold by
Kb Building & Development Llc
Bought by
Carlson Kyle and Carlson Kristen
Current Estimated Value
Home Financials for this Owner
Home Financials are based on the most recent Mortgage that was taken out on this home.
Original Mortgage
$171,204
Outstanding Balance
$136,569
Interest Rate
3.64%
Mortgage Type
New Conventional
Estimated Equity
$222,882
Purchase Details
Closed on
Oct 5, 2015
Sold by
Joyner E Carroll
Bought by
Kb Building & Development Llc
Home Financials for this Owner
Home Financials are based on the most recent Mortgage that was taken out on this home.
Original Mortgage
$115,000
Interest Rate
3.97%
Mortgage Type
Construction
Purchase Details
Closed on
Jul 18, 2012
Sold by
Atlas Nc Ii Spe Llc
Bought by
Joyner E Carroll
Purchase Details
Closed on
May 2, 2012
Sold by
Dfb Development Company Inc
Bought by
Atlas Nc Ii Spe Llc
Create a Home Valuation Report for This Property
The Home Valuation Report is an in-depth analysis detailing your home's value as well as a comparison with similar homes in the area
Home Values in the Area
Average Home Value in this Area
Purchase History
| Date | Buyer | Sale Price | Title Company |
|---|---|---|---|
| Carlson Kyle | $196,500 | Attorney | |
| Kb Building & Development Llc | $18,000 | Attorney | |
| Joyner E Carroll | $200,000 | None Available | |
| Atlas Nc Ii Spe Llc | $233,800 | None Available |
Source: Public Records
Mortgage History
| Date | Status | Borrower | Loan Amount |
|---|---|---|---|
| Open | Carlson Kyle | $171,204 | |
| Previous Owner | Kb Building & Development Llc | $115,000 |
Source: Public Records
Tax History
| Year | Tax Paid | Tax Assessment Tax Assessment Total Assessment is a certain percentage of the fair market value that is determined by local assessors to be the total taxable value of land and additions on the property. | Land | Improvement |
|---|---|---|---|---|
| 2025 | $3,382 | $270,590 | $16,630 | $253,960 |
| 2024 | $3,391 | $184,340 | $16,630 | $167,710 |
| 2023 | $2,481 | $184,340 | $0 | $0 |
| 2022 | $2,479 | $184,340 | $16,630 | $167,710 |
| 2021 | $2,443 | $184,340 | $15,590 | $168,750 |
| 2020 | $2,443 | $184,340 | $15,590 | $168,750 |
| 2019 | $2,444 | $184,340 | $15,590 | $168,750 |
| 2018 | $2,433 | $184,340 | $0 | $0 |
| 2017 | $2,433 | $184,340 | $0 | $0 |
| 2015 | $206 | $15,590 | $0 | $0 |
| 2014 | $198 | $15,590 | $0 | $0 |
Source: Public Records
Map
Nearby Homes
- 12670 School House Rd
- 12934 W Hanes St
- 10222 S Chestnut St
- 12658 W Hanes Ave
- 9154 Phoenix Ct
- 00 U S 264 Alternate E
- 0 U S 264 Alternate E
- 13096 N Carolina 231
- 11575 Rockside Rd
- 11723 Salers Loop
- 11793 Salers Loop
- 11730 Salers Loop
- 11754 Salers Loop
- 11766 Salers Loop
- 11224 Salers Loop
- 6712 Jersey Rd
- 11273 Salers Loop
- 11287 Salers Loop
- 11335 Salers Loop
- 6782 Pinecrest Rd
Your Personal Tour Guide
Ask me questions while you tour the home.