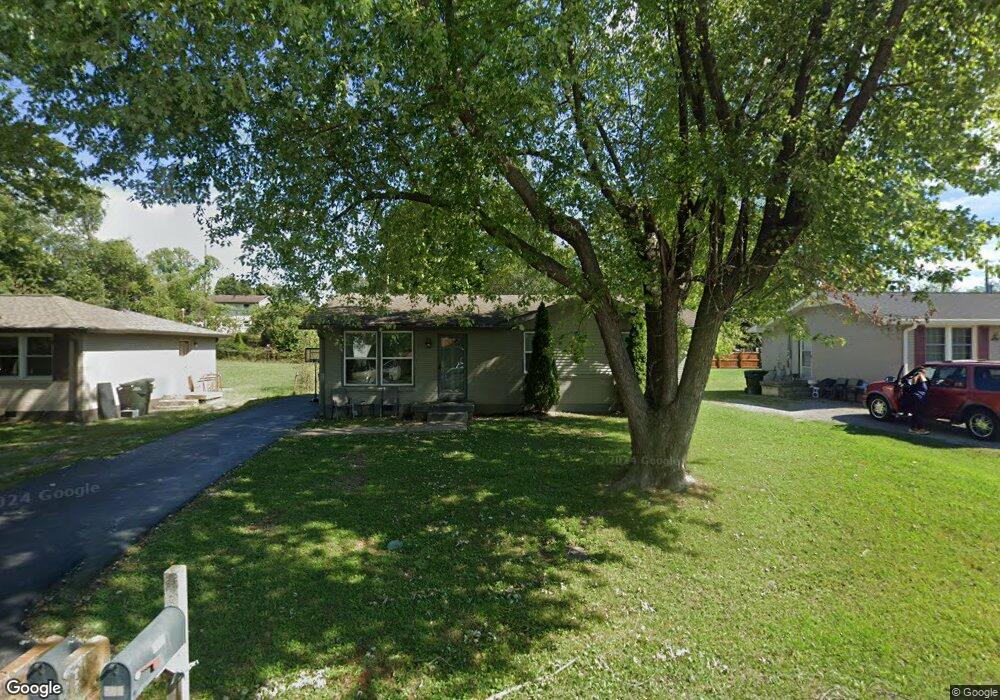
806 Perry Dr Springfield, TN 37172
Estimated Value: $168,000 - $225,000
Studio
1
Bath
1,050
Sq Ft
$186/Sq Ft
Est. Value
About This Home
This home is located at 806 Perry Dr, Springfield, TN 37172 and is currently estimated at $194,915, approximately $185 per square foot. 806 Perry Dr is a home located in Robertson County with nearby schools including Krisle Elementary School, Innovation Academy, and Springfield High School.
Ownership History
Date
Name
Owned For
Owner Type
Purchase Details
Closed on
May 31, 2018
Sold by
King Joe D and King Elizabeth B
Bought by
Hurt Derrick A
Current Estimated Value
Home Financials for this Owner
Home Financials are based on the most recent Mortgage that was taken out on this home.
Original Mortgage
$99,085
Outstanding Balance
$71,611
Interest Rate
4.4%
Mortgage Type
Commercial
Estimated Equity
$123,304
Purchase Details
Closed on
Jul 19, 1996
Sold by
King Joe D
Bought by
King Joe D and King Elizabeth B
Purchase Details
Closed on
Jul 13, 1996
Sold by
King Joe D
Bought by
King Joe D
Purchase Details
Closed on
Feb 4, 1996
Sold by
King Joe D
Bought by
Northington Charlesetta El
Purchase Details
Closed on
Mar 22, 1973
Bought by
Ellis Atlanta
Create a Home Valuation Report for This Property
The Home Valuation Report is an in-depth analysis detailing your home's value as well as a comparison with similar homes in the area
Home Values in the Area
Average Home Value in this Area
Purchase History
| Date | Buyer | Sale Price | Title Company |
|---|---|---|---|
| Hurt Derrick A | $85,000 | Warranty Title Ins Co Inc | |
| King Joe D | -- | -- | |
| King Joe D | $35,000 | -- | |
| Northington Charlesetta El | -- | -- | |
| Ellis Atlanta | -- | -- |
Source: Public Records
Mortgage History
| Date | Status | Borrower | Loan Amount |
|---|---|---|---|
| Open | Hurt Derrick A | $99,085 |
Source: Public Records
Tax History
| Year | Tax Paid | Tax Assessment Tax Assessment Total Assessment is a certain percentage of the fair market value that is determined by local assessors to be the total taxable value of land and additions on the property. | Land | Improvement |
|---|---|---|---|---|
| 2025 | -- | $44,250 | $15,000 | $29,250 |
| 2024 | -- | $44,250 | $15,000 | $29,250 |
| 2023 | $1,109 | $44,250 | $15,000 | $29,250 |
| 2022 | $724 | $19,825 | $3,450 | $16,375 |
| 2021 | $724 | $19,825 | $3,450 | $16,375 |
| 2020 | $666 | $19,825 | $3,450 | $16,375 |
| 2019 | $20,070 | $18,250 | $3,450 | $14,800 |
| 2018 | $666 | $18,250 | $3,450 | $14,800 |
| 2017 | $635 | $14,800 | $2,550 | $12,250 |
| 2016 | $635 | $14,800 | $2,550 | $12,250 |
| 2015 | $616 | $14,800 | $2,550 | $12,250 |
| 2014 | $616 | $14,800 | $2,550 | $12,250 |
Source: Public Records
Map
Nearby Homes
- 54 Hunters Ln
- 703 Hayes St
- 906 Spruce St
- 805 8th Ave E
- 1055 Mustang Ct
- 1183 Hangar Rd
- 813 5th Ave E
- 600 10th Ave E
- 415 Durrett St
- 600 5th Ave E
- 500 5th Ave E
- 952 N Brown St
- 817 N Brown St
- 401 S Pawnee Dr
- 633 E 17th Ave
- 109 E 7th Ave
- 305 S Pawnee Dr
- 1800 Meadowbrook Dr
- 1 Tom Austin Hwy
- 5295 Matthews St
Your Personal Tour Guide
Ask me questions while you tour the home.