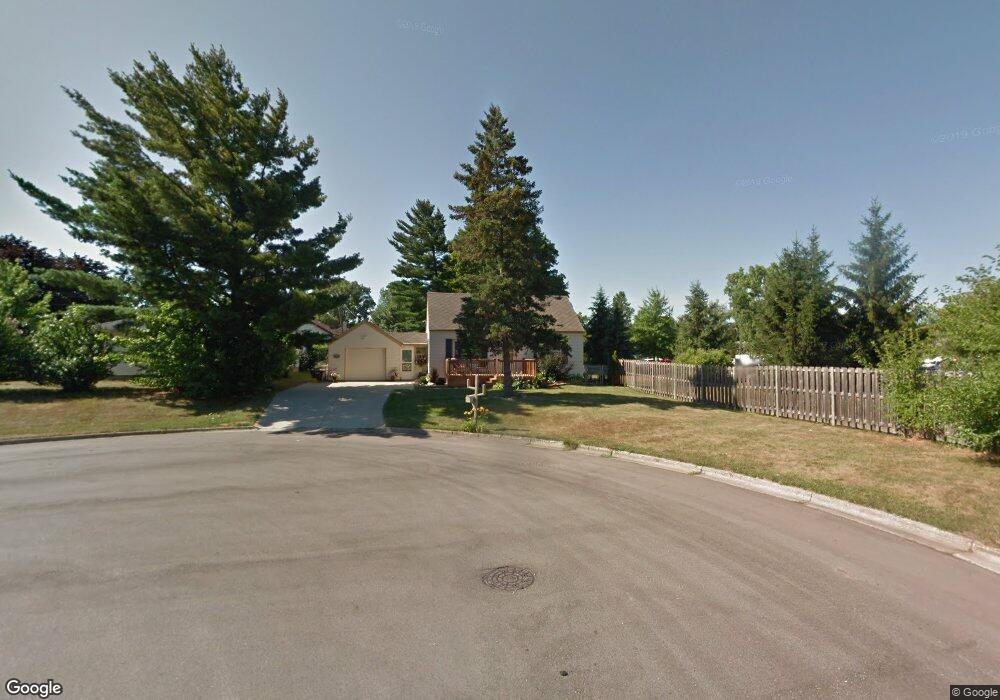
806 Sims Ct Lansing, MI 48911
Southern Lansing NeighborhoodEstimated Value: $140,712 - $154,000
Studio
--
Bath
989
Sq Ft
$147/Sq Ft
Est. Value
About This Home
This home is located at 806 Sims Ct, Lansing, MI 48911 and is currently estimated at $144,928, approximately $146 per square foot. 806 Sims Ct is a home located in Ingham County with nearby schools including Kendon School, Attwood School, and Everett High School.
Ownership History
Date
Name
Owned For
Owner Type
Purchase Details
Closed on
Aug 30, 2004
Sold by
The Estate Of Frances A Patson
Bought by
Clevenger Michael J
Current Estimated Value
Home Financials for this Owner
Home Financials are based on the most recent Mortgage that was taken out on this home.
Original Mortgage
$91,603
Outstanding Balance
$45,534
Interest Rate
5.93%
Mortgage Type
FHA
Estimated Equity
$99,394
Purchase Details
Closed on
May 21, 2004
Sold by
Estate Of Frances A Patson
Bought by
Clevengre Angela K and Chapko Patricia A
Create a Home Valuation Report for This Property
The Home Valuation Report is an in-depth analysis detailing your home's value as well as a comparison with similar homes in the area
Home Values in the Area
Average Home Value in this Area
Purchase History
| Date | Buyer | Sale Price | Title Company |
|---|---|---|---|
| Clevenger Michael J | $93,000 | Professional Title & Mortgag | |
| Clevengre Angela K | -- | -- |
Source: Public Records
Mortgage History
| Date | Status | Borrower | Loan Amount |
|---|---|---|---|
| Open | Clevenger Michael J | $91,603 |
Source: Public Records
Tax History
| Year | Tax Paid | Tax Assessment Tax Assessment Total Assessment is a certain percentage of the fair market value that is determined by local assessors to be the total taxable value of land and additions on the property. | Land | Improvement |
|---|---|---|---|---|
| 2025 | $3,172 | $65,300 | $10,700 | $54,600 |
| 2024 | $26 | $53,800 | $10,700 | $43,100 |
| 2023 | $2,985 | $49,300 | $10,700 | $38,600 |
| 2022 | $2,725 | $42,500 | $10,000 | $32,500 |
| 2021 | $2,662 | $39,000 | $6,900 | $32,100 |
| 2020 | $2,643 | $38,100 | $6,900 | $31,200 |
| 2019 | $2,554 | $36,500 | $6,900 | $29,600 |
| 2018 | $2,422 | $33,200 | $6,900 | $26,300 |
| 2017 | $2,331 | $33,200 | $6,900 | $26,300 |
| 2016 | $2,238 | $32,600 | $6,900 | $25,700 |
| 2015 | $2,238 | $31,600 | $13,733 | $17,867 |
| 2014 | $2,238 | $29,800 | $17,166 | $12,634 |
Source: Public Records
Map
Nearby Homes
- 1109 Barr Ave
- 1115 Shirley St
- 4815 S Pennsylvania Ave
- 4719 S Pennsylvania Ave
- 1101 Kendon Dr
- 5808 Orchard Ct
- 629 Emily Ave
- 205 E Jolly Rd Unit 6
- 0 Glenwood Ave
- 208 E Northrup St
- 600 E Cavanaugh Rd
- 201 E Syringa Dr
- 801 Jessop Ave
- 817 Jessop Ave
- 709 Jessop Ave
- 810 Fenton St
- 601 Jessop Ave
- 111 E Potter Ave
- 3907 Glenwood Ave
- 0 N Aurelius Rd
Your Personal Tour Guide
Ask me questions while you tour the home.