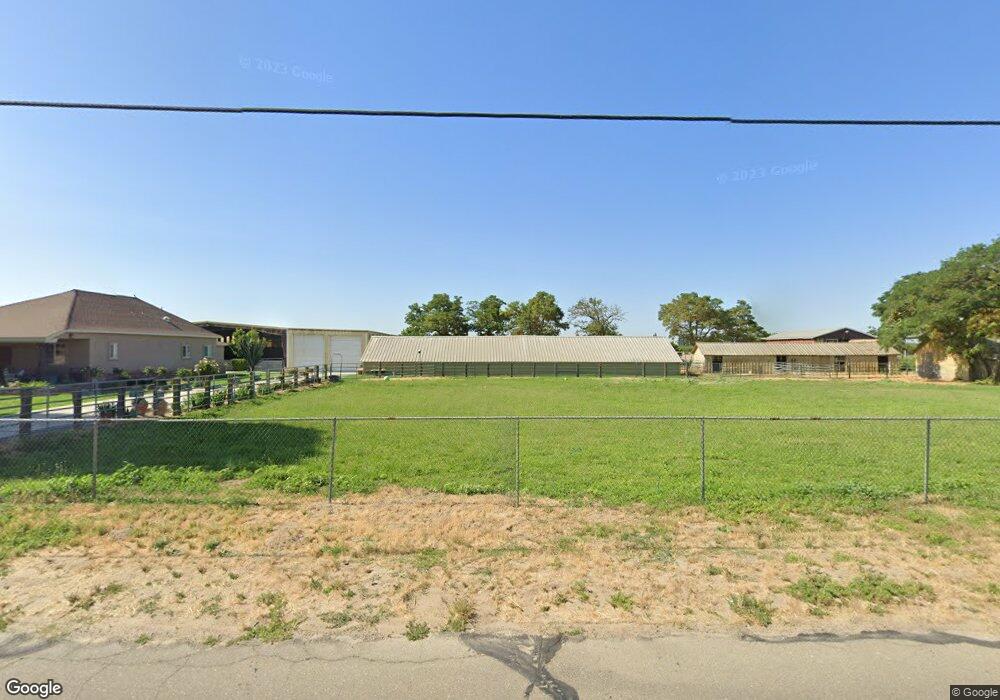
806 W Harding Rd Turlock, CA 95380
Estimated Value: $423,000 - $610,593
3
Beds
2
Baths
1,857
Sq Ft
$293/Sq Ft
Est. Value
About This Home
This home is located at 806 W Harding Rd, Turlock, CA 95380 and is currently estimated at $543,531, approximately $292 per square foot. 806 W Harding Rd is a home located in Stanislaus County with nearby schools including Chatom Elementary School, Marvin A. Dutcher Middle School, and Turlock Junior High School.
Ownership History
Date
Name
Owned For
Owner Type
Purchase Details
Closed on
Aug 1, 2024
Sold by
Townsend Dorothy Ann
Bought by
Dorothy Townsend Living Trust and Townsend
Current Estimated Value
Purchase Details
Closed on
Sep 23, 2021
Sold by
Douglas Peters Dwight
Bought by
Dwight And Mary Peters Living Trust
Purchase Details
Closed on
Sep 9, 2021
Sold by
Peters Mary E
Bought by
Peters Mary E and Townsend Dorothy Ann
Purchase Details
Closed on
Aug 30, 2018
Sold by
Peters Dwight D and Peters Mary E
Bought by
Peters Dwight D and Peters Mary E
Purchase Details
Closed on
May 9, 2018
Sold by
Peters Mary E
Bought by
Peters Dwight D and Peters Mary E
Purchase Details
Closed on
Oct 16, 2002
Sold by
Dwight D & Mary E Peters Living Trust
Bought by
Mary E Peters Trust
Create a Home Valuation Report for This Property
The Home Valuation Report is an in-depth analysis detailing your home's value as well as a comparison with similar homes in the area
Home Values in the Area
Average Home Value in this Area
Purchase History
| Date | Buyer | Sale Price | Title Company |
|---|---|---|---|
| Dorothy Townsend Living Trust | -- | None Listed On Document | |
| Dwight And Mary Peters Living Trust | -- | -- | |
| Peters Mary E | -- | None Listed On Document | |
| Peters Mary E | -- | None Available | |
| Peters Dwight D | -- | None Available | |
| Peters Dwight D | -- | None Available | |
| Mary E Peters Trust | -- | -- |
Source: Public Records
Tax History Compared to Growth
Tax History
| Year | Tax Paid | Tax Assessment Tax Assessment Total Assessment is a certain percentage of the fair market value that is determined by local assessors to be the total taxable value of land and additions on the property. | Land | Improvement |
|---|---|---|---|---|
| 2025 | $1,897 | $181,164 | $63,446 | $117,718 |
| 2024 | $1,851 | $177,612 | $62,202 | $115,410 |
| 2023 | $1,851 | $174,131 | $60,983 | $113,148 |
| 2022 | $1,824 | $170,718 | $59,788 | $110,930 |
| 2021 | $1,795 | $167,371 | $58,616 | $108,755 |
| 2020 | $1,771 | $165,655 | $58,015 | $107,640 |
| 2019 | $1,743 | $162,408 | $56,878 | $105,530 |
| 2018 | $1,740 | $159,224 | $55,763 | $103,461 |
| 2017 | $1,683 | $156,103 | $54,670 | $101,433 |
| 2016 | $1,618 | $152,404 | $52,959 | $99,445 |
| 2015 | $1,612 | $150,715 | $52,763 | $97,952 |
| 2014 | $1,571 | $146,684 | $50,650 | $96,034 |
Source: Public Records
Map
Nearby Homes
- 0 California 165
- 4319 S Walnut Rd
- 0 Nowlin Ct Unit MC25229979
- 0 Nowlin Ct Unit 225127751
- 432 E Glenwood Ave
- 2007 W Glenwood Ave
- 1118 E Harding Rd
- 2333 Lander Ave
- 572 Harvest Park Dr
- 305 Montana Ave
- 460 E Linwood Ave
- 251 Clark St
- 300 Lewis St
- 1165 Boxwood Way
- 0 S Walnut Rd
- 917 9th St
- 967 Lavon New Ln
- 808 West Ave S
- 1412 E Glenwood Ave
- 1820 Julep Way
- 912 W Harding Rd
- 712 W Harding Rd
- 1018 W Harding Rd
- 530 W Harding Rd
- 0 W Harding Rd Unit 18002607
- 0 W Harding Rd
- 3119 Curtion Ave
- 3009 Curtion Ave
- 3100 Curtion Ave
- 1124 W Greenway Ave
- 2943 Curtion Ave
- 3336 S Soderquist Rd
- 0 E Harding Rd
- 0 E Harding Rd Unit 19069307
- 3006 Curtion Ave
- 418 W Harding Rd
- 2917 Curtion Ave
- 1200 W Harding Rd
- 800 W Greenway Ave
- 620 W Greenway Ave