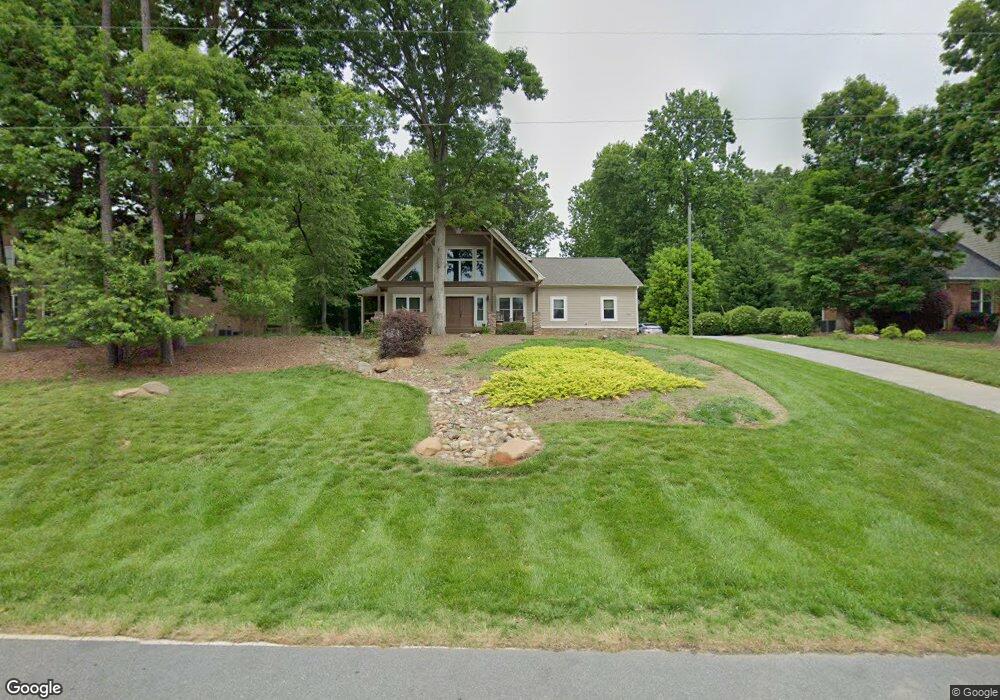
8061 Mcconnell Rd Denver, NC 28037
Estimated Value: $686,000 - $987,000
3
Beds
3
Baths
2,453
Sq Ft
$338/Sq Ft
Est. Value
About This Home
This home is located at 8061 Mcconnell Rd, Denver, NC 28037 and is currently estimated at $828,804, approximately $337 per square foot. 8061 Mcconnell Rd is a home with nearby schools including Rock Springs Elementary School, North Lincoln Middle School, and North Lincoln High School.
Ownership History
Date
Name
Owned For
Owner Type
Purchase Details
Closed on
Jul 14, 2016
Sold by
Starita Richard F
Bought by
Starita Richard F
Current Estimated Value
Home Financials for this Owner
Home Financials are based on the most recent Mortgage that was taken out on this home.
Original Mortgage
$121,100
Outstanding Balance
$96,923
Interest Rate
3.66%
Mortgage Type
New Conventional
Estimated Equity
$731,881
Purchase Details
Closed on
Feb 24, 2011
Sold by
Starita Raffaela C
Bought by
Starita Richard F
Purchase Details
Closed on
Jul 14, 2005
Sold by
West Jodie S and West Don
Bought by
Starita Richard F and Starita Raffaela C
Purchase Details
Closed on
Apr 29, 2004
Bought by
West Jodie S and West Don
Purchase Details
Closed on
Feb 5, 2003
Bought by
Smith Powell Lee
Purchase Details
Closed on
May 6, 2002
Bought by
Paille Edward R and Paille Young S
Create a Home Valuation Report for This Property
The Home Valuation Report is an in-depth analysis detailing your home's value as well as a comparison with similar homes in the area
Home Values in the Area
Average Home Value in this Area
Purchase History
| Date | Buyer | Sale Price | Title Company |
|---|---|---|---|
| Starita Richard F | -- | None Available | |
| Starita Richard F | -- | None Available | |
| Starita Richard F | $95,000 | None Available | |
| West Jodie S | $60,000 | -- | |
| Smith Powell Lee | $35,000 | -- | |
| Paille Edward R | $35,000 | -- |
Source: Public Records
Mortgage History
| Date | Status | Borrower | Loan Amount |
|---|---|---|---|
| Open | Starita Richard F | $121,100 |
Source: Public Records
Tax History Compared to Growth
Tax History
| Year | Tax Paid | Tax Assessment Tax Assessment Total Assessment is a certain percentage of the fair market value that is determined by local assessors to be the total taxable value of land and additions on the property. | Land | Improvement |
|---|---|---|---|---|
| 2025 | $3,857 | $614,386 | $107,604 | $506,782 |
| 2024 | $3,825 | $614,386 | $107,604 | $506,782 |
| 2023 | $3,825 | $614,386 | $107,604 | $506,782 |
| 2022 | $2,941 | $381,437 | $85,634 | $295,803 |
| 2021 | $2,915 | $381,437 | $85,634 | $295,803 |
| 2020 | $2,723 | $381,437 | $85,634 | $295,803 |
| 2019 | $2,723 | $381,437 | $85,634 | $295,803 |
| 2018 | $2,445 | $322,806 | $78,709 | $244,097 |
| 2017 | $2,344 | $322,806 | $78,709 | $244,097 |
| 2016 | $2,336 | $322,806 | $78,709 | $244,097 |
| 2015 | $2,375 | $322,806 | $78,709 | $244,097 |
| 2014 | $753 | $106,373 | $106,373 | $0 |
Source: Public Records
Map
Nearby Homes
- 7861 Live Oaks Dr
- 4907 White Oak Ln
- 5086 Windward Point Ln
- 4853 Austin Shores Dr
- 4548 Stonesthrow Dr
- 5056 Bridge Way
- 4628 Sierra View Dr
- 00 Hawkes Bay Ct Unit 121
- 4550 Osprey Run Ct
- 102 Stone Point Ct
- 150 Fawn Ln
- 7674 Bermuda Hills Ln
- 4511 Morning Dove Ct
- 4424 Augusta Ridge Ct
- 472 Barber Loop
- 3988 Channel Point Ln
- 00 Summit Ridge Ln
- 388 Stonemarker Rd
- 512 Stonemarker Rd
- 4599 Rustling Woods Dr
- 8047 Mcconnell Rd
- 8047 Mcconnell Rd Unit 5
- 8069 Mcconnell Rd
- 8060 Mcconnell Rd
- 8087 Mcconnell Rd
- 8078 Mcconnell Rd
- 8029 Mcconnell Rd
- 8042 Mcconnell Rd
- 7731 Cambridge Way
- 8088 Mcconnell Rd
- 8097 Mcconnell Rd
- 8030 Mcconnell Rd
- 7737 Cambridge Way
- Lot 8 Mcconnell Rd Unit 8
- 7757 Live Oaks Dr
- 5079 Fox Hollow Dr
- 5079 Fox Hollow Dr Unit Lot 14 also
- 6 Live Oaks Dr
- 7767 Live Oaks Dr
- 8135 Mcconnell Rd