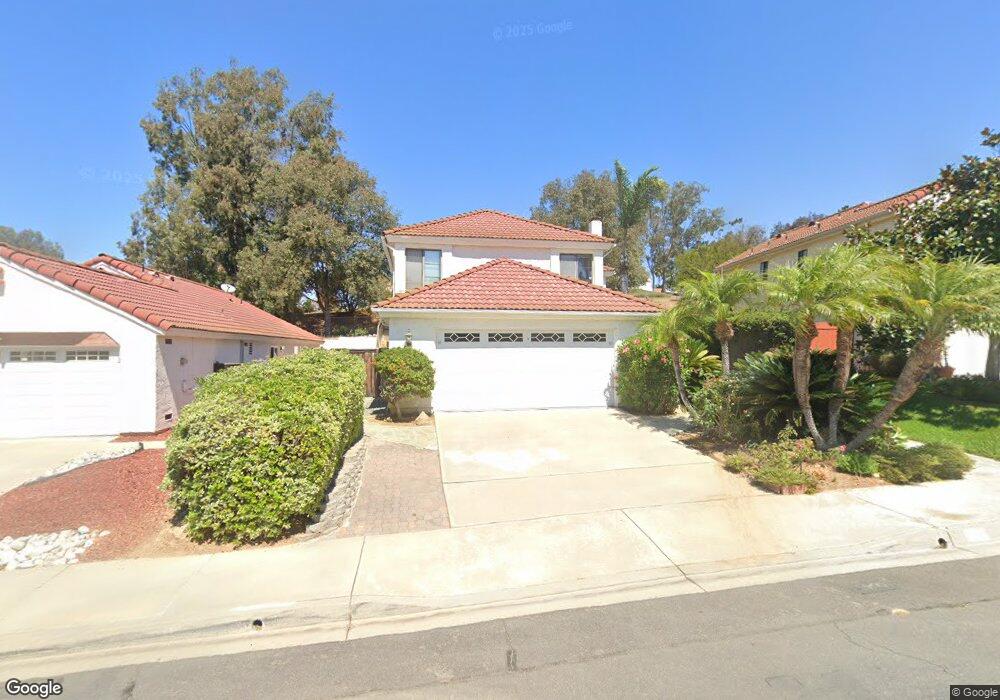
807 Applewilde Dr Unit 2 San Marcos, CA 92078
Barham Discovery Community NeighborhoodEstimated Value: $1,102,000 - $1,126,000
4
Beds
3
Baths
1,734
Sq Ft
$641/Sq Ft
Est. Value
About This Home
This home is located at 807 Applewilde Dr Unit 2, San Marcos, CA 92078 and is currently estimated at $1,110,814, approximately $640 per square foot. 807 Applewilde Dr Unit 2 is a home located in San Diego County with nearby schools including Discovery Elementary School, San Elijo Middle School, and San Marcos High School.
Ownership History
Date
Name
Owned For
Owner Type
Purchase Details
Closed on
Jun 5, 2008
Sold by
Hill Philip Timothy and Hill Romy Hiromi Nitta
Bought by
Hill Philip Timothy and Hill Romy Hiromi Nitta
Current Estimated Value
Purchase Details
Closed on
May 8, 2007
Sold by
Clizbe Daniel B and Sargent Belinda J
Bought by
Hill Philip and Hill Romy Nitta
Home Financials for this Owner
Home Financials are based on the most recent Mortgage that was taken out on this home.
Original Mortgage
$332,350
Outstanding Balance
$196,373
Interest Rate
1%
Mortgage Type
Negative Amortization
Estimated Equity
$914,441
Purchase Details
Closed on
Dec 17, 1996
Sold by
Clizbe Daniel B
Bought by
Clizbe Daniel B and Sargent Belinda J
Purchase Details
Closed on
Oct 14, 1993
Sold by
Sargent Belinda J
Bought by
Clizbe Daniel B
Purchase Details
Closed on
Nov 3, 1992
Purchase Details
Closed on
Nov 23, 1987
Purchase Details
Closed on
Aug 22, 1986
Create a Home Valuation Report for This Property
The Home Valuation Report is an in-depth analysis detailing your home's value as well as a comparison with similar homes in the area
Home Values in the Area
Average Home Value in this Area
Purchase History
| Date | Buyer | Sale Price | Title Company |
|---|---|---|---|
| Hill Philip Timothy | -- | None Available | |
| Hill Philip | $536,000 | Financial Title Company | |
| Clizbe Daniel B | -- | -- | |
| Clizbe Daniel B | -- | South Coast Title Co | |
| -- | $177,900 | -- | |
| -- | $126,500 | -- | |
| -- | $128,000 | -- |
Source: Public Records
Mortgage History
| Date | Status | Borrower | Loan Amount |
|---|---|---|---|
| Open | Hill Philip | $332,350 |
Source: Public Records
Tax History
| Year | Tax Paid | Tax Assessment Tax Assessment Total Assessment is a certain percentage of the fair market value that is determined by local assessors to be the total taxable value of land and additions on the property. | Land | Improvement |
|---|---|---|---|---|
| 2025 | $7,765 | $718,083 | $455,502 | $262,581 |
| 2024 | $7,765 | $704,004 | $446,571 | $257,433 |
| 2023 | $7,621 | $690,201 | $437,815 | $252,386 |
| 2022 | $7,517 | $676,669 | $429,231 | $247,438 |
| 2021 | $7,392 | $663,402 | $420,815 | $242,587 |
| 2020 | $7,321 | $656,601 | $416,501 | $240,100 |
| 2019 | $7,238 | $643,728 | $408,335 | $235,393 |
| 2018 | $7,007 | $631,107 | $400,329 | $230,778 |
| 2017 | $6,439 | $580,000 | $366,000 | $214,000 |
| 2016 | $6,022 | $540,000 | $341,000 | $199,000 |
| 2015 | $5,577 | $500,000 | $316,000 | $184,000 |
| 2014 | $4,666 | $420,000 | $266,000 | $154,000 |
Source: Public Records
Map
Nearby Homes
- 809 Discovery St Unit 77
- 1027 Honeysuckle Dr
- 1030 Cima Dr
- 914 Applewilde Dr
- 1234 Granada Way
- 880 W San Marcos Blvd
- 1051 La Reina Dr
- 1286 Discovery St Unit 82
- 1286 Discovery St Unit 148
- 1286 Discovery St Unit 130
- 1286 Discovery St Unit SPC 16
- 1286 Discovery St Unit 92
- 1122 Via Vera Cruz Unit 2
- 985 San Pablo Dr Unit 2
- 1039 San Pablo Dr
- 1886 Fairway Circle Dr
- 0 S Las Posas Rd
- 1875 San Pablo Dr
- 550 Echo Ln
- 1790 La Plaza Dr
- 809 Applewilde Dr
- 805 Applewilde Dr
- 811 Applewilde Dr
- 804 Smoketree Ct
- 813 Applewilde Dr
- 806 Smoketree Ct
- 810 Applewilde Dr
- 817 Applewilde Dr Unit 2
- 808 Smoketree Ct Unit 1
- 508 Honeyglen Dr Unit 3
- 816 Applewilde Dr
- 797 Crestview Ct
- 789 Crestview Ct
- 821 Applewilde Dr
- 781 Crestview Ct
- 801 Crestview Ct
- 512 Honeyglen Dr
- 812 Smoketree Ct
- 504 Honeyglen Dr
- 822 Applewilde Dr
Your Personal Tour Guide
Ask me questions while you tour the home.