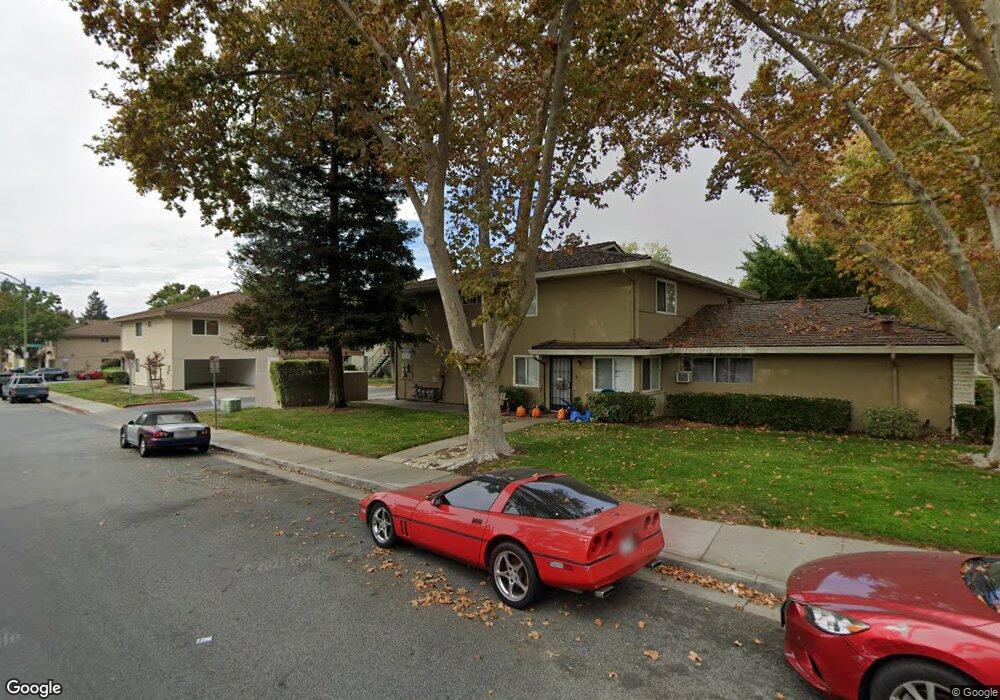
807 Gilchrist Walkway Unit 3 San Jose, CA 95133
Penitencia NeighborhoodEstimated Value: $499,504 - $567,000
2
Beds
1
Bath
903
Sq Ft
$588/Sq Ft
Est. Value
About This Home
This home is located at 807 Gilchrist Walkway Unit 3, San Jose, CA 95133 and is currently estimated at $530,626, approximately $587 per square foot. 807 Gilchrist Walkway Unit 3 is a home located in Santa Clara County with nearby schools including Summerdale Elementary School, Piedmont Middle School, and Independence High School.
Ownership History
Date
Name
Owned For
Owner Type
Purchase Details
Closed on
Aug 2, 2017
Sold by
Dheri Santokh S
Bought by
Dheri Santokh Singh
Current Estimated Value
Purchase Details
Closed on
Nov 19, 2008
Sold by
Downey Savings & Loan Association Fa
Bought by
Dheri Santokh S and Kaur Daljit
Purchase Details
Closed on
Dec 20, 2007
Sold by
Martinez Juliana
Bought by
Fa Downey Sla
Purchase Details
Closed on
Mar 10, 2005
Sold by
Martinez Nick
Bought by
Martinez Juliana
Home Financials for this Owner
Home Financials are based on the most recent Mortgage that was taken out on this home.
Original Mortgage
$248,000
Interest Rate
7.5%
Mortgage Type
Purchase Money Mortgage
Purchase Details
Closed on
Dec 29, 1995
Sold by
Melendez Cathleen M
Bought by
Melendez Norma
Purchase Details
Closed on
Dec 28, 1995
Sold by
Melendez Norma
Bought by
Ramirez Maria Elena
Create a Home Valuation Report for This Property
The Home Valuation Report is an in-depth analysis detailing your home's value as well as a comparison with similar homes in the area
Home Values in the Area
Average Home Value in this Area
Purchase History
| Date | Buyer | Sale Price | Title Company |
|---|---|---|---|
| Dheri Santokh Singh | -- | None Available | |
| Dheri Santokh S | $160,000 | Southland Title Company | |
| Fa Downey Sla | $243,750 | None Available | |
| Martinez Juliana | -- | Ticor Title Company | |
| Martinez Juliana | $310,000 | Ticor Title Company | |
| Melendez Norma | $50,500 | -- | |
| Ramirez Maria Elena | -- | -- |
Source: Public Records
Mortgage History
| Date | Status | Borrower | Loan Amount |
|---|---|---|---|
| Previous Owner | Martinez Juliana | $248,000 |
Source: Public Records
Tax History Compared to Growth
Tax History
| Year | Tax Paid | Tax Assessment Tax Assessment Total Assessment is a certain percentage of the fair market value that is determined by local assessors to be the total taxable value of land and additions on the property. | Land | Improvement |
|---|---|---|---|---|
| 2025 | $3,209 | $206,024 | $103,012 | $103,012 |
| 2024 | $3,209 | $201,986 | $100,993 | $100,993 |
| 2023 | $3,142 | $198,026 | $99,013 | $99,013 |
| 2022 | $3,141 | $194,144 | $97,072 | $97,072 |
| 2021 | $3,040 | $190,338 | $95,169 | $95,169 |
| 2020 | $2,974 | $188,388 | $94,194 | $94,194 |
| 2019 | $2,874 | $184,696 | $92,348 | $92,348 |
| 2018 | $2,836 | $181,076 | $90,538 | $90,538 |
| 2017 | $2,849 | $177,526 | $88,763 | $88,763 |
| 2016 | $2,724 | $174,046 | $87,023 | $87,023 |
| 2015 | $2,686 | $171,432 | $85,716 | $85,716 |
| 2014 | $2,537 | $168,074 | $84,037 | $84,037 |
Source: Public Records
Map
Nearby Homes
- 825 N Capitol Ave Unit 4
- 674 Galleon Ct
- 714 N Capitol Ave
- 2714 Mabury Square
- 709 Whitewater Ct Unit 44
- 985 Harcot Ct
- 990 Harcot Ct
- 981 Harcot Ct
- 997 Harcot Ct
- 994 Harcot Ct
- 970 E Harcot Ct
- 982 Harcot Ct
- 998 Harcot Ct
- 633 Easton Dr
- Residence 2 Plan at Ascend
- Residence 1 Plan at Ascend
- Residence 3 Plan at Ascend
- 2369 Mabury Rd
- 2623 Gimelli Place Unit 139
- 2599 Easton Ln Unit 108
- 807 Gilchrist Walkway Unit 4
- 807 Gilchrist Dr Unit 1
- 807 Gilchrist Dr Unit 3
- 807 Gilchrist Dr Unit 2
- 807 Gilchrist Walkway Unit 1
- 807 Gilchrist Walkway Unit 4
- 807 Gilchrist Walkway Unit 2
- 815 Gilchrist Dr Unit 3
- 815 Gilchrist Dr Unit 1
- 815 Gilchrist Walkway Unit 1
- 815 Gilchrist Walkway Unit 3
- 815 Gilchrist Walkway Unit 2
- 806 Gilchrist Dr Unit 2
- 806 Gilchrist Dr Unit 3
- 806 Gilchrist Dr Unit 4
- 823 Gilchrist Walkway Unit 1
- 823 Gilchrist Walkway Unit 4
- 823 Gilchrist Walkway Unit 1
- 823 Gilchrist Walkway Unit 2
- 823 Gilchrist Walkway Unit 3