Estimated Value: $530,000 - $557,000
5
Beds
3
Baths
2,156
Sq Ft
$254/Sq Ft
Est. Value
About This Home
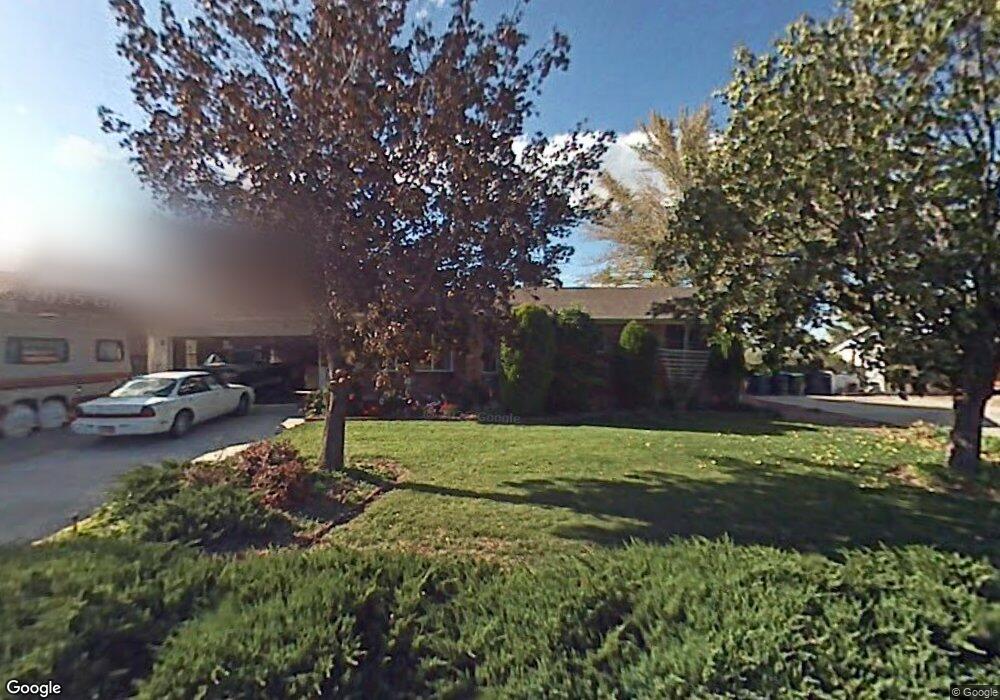
This home is located at 8078 S Bryce Dr, Sandy, UT 84070 and is currently estimated at $547,595, approximately $253 per square foot. 8078 S Bryce Dr is a home located in Salt Lake County with nearby schools including Midvalley Elementary School, Union Middle School, and Hillcrest High School.
Ownership History
Date
Name
Owned For
Owner Type
Purchase Details
Closed on
Oct 29, 2024
Sold by
Al-Safadi Wendy L Hill
Bought by
Safadi Issa Y
Current Estimated Value
Purchase Details
Closed on
Aug 19, 2024
Sold by
Max And Donna Petersen Irrevocable Trust and Petersen Leeland
Bought by
Al-Safadi Wendy L Hill and Al-Safadi Issa Y
Purchase Details
Closed on
Jun 10, 2024
Sold by
Al-Safadi Wendy
Bought by
Al-Safadi Issa Yusef
Purchase Details
Closed on
Jan 12, 2018
Sold by
Petersen Leeland
Bought by
Hill Al Safadi Wendy L and Al Safadi Issa Y
Home Financials for this Owner
Home Financials are based on the most recent Mortgage that was taken out on this home.
Original Mortgage
$265,567
Interest Rate
4.12%
Mortgage Type
FHA
Purchase Details
Closed on
Jul 21, 2017
Sold by
Petersen Max J and Petersen Donna M
Bought by
Petersen Leeland
Create a Home Valuation Report for This Property
The Home Valuation Report is an in-depth analysis detailing your home's value as well as a comparison with similar homes in the area
Home Values in the Area
Average Home Value in this Area
Purchase History
| Date | Buyer | Sale Price | Title Company |
|---|---|---|---|
| Safadi Issa Y | -- | None Listed On Document | |
| Safadi Issa Y | -- | None Listed On Document | |
| Al-Safadi Wendy L Hill | -- | Inwest Title Services | |
| Al-Safadi Issa Yusef | -- | None Listed On Document | |
| Hill Al Safadi Wendy L | -- | Inwest Title Srvs Slc | |
| Petersen Leeland | -- | Inwest Title Srvs Slc |
Source: Public Records
Mortgage History
| Date | Status | Borrower | Loan Amount |
|---|---|---|---|
| Previous Owner | Hill Al Safadi Wendy L | $265,567 |
Source: Public Records
Tax History
| Year | Tax Paid | Tax Assessment Tax Assessment Total Assessment is a certain percentage of the fair market value that is determined by local assessors to be the total taxable value of land and additions on the property. | Land | Improvement |
|---|---|---|---|---|
| 2025 | $2,837 | $458,500 | $127,400 | $331,100 |
| 2024 | $2,837 | $453,200 | $119,700 | $333,500 |
| 2023 | $2,461 | $390,100 | $113,800 | $276,300 |
| 2022 | $2,530 | $399,500 | $111,600 | $287,900 |
| 2021 | $2,327 | $310,800 | $97,000 | $213,800 |
| 2020 | $2,204 | $280,300 | $78,600 | $201,700 |
| 2019 | $1,877 | $264,000 | $78,600 | $185,400 |
| 2016 | $684 | $214,300 | $69,800 | $144,500 |
Source: Public Records
Map
Nearby Homes
- 393 E Corral Creek Dr
- 379 E Horse Creek Dr
- 8087 S 615 E
- 274 E Water Mill Way Unit 230
- 257 Water Mill Way Unit 211
- 257 E Water Mill Way
- 397 E Tractor Dr Unit 103
- 8322 S Levine Ln Unit 111
- 7824 S 280 E
- 190 E White Spruce Cove Unit 805
- 760 E 8080 S
- 7869 S 700 E
- 8023 S Pinewood Dr
- 359 E 8400 S
- 135 E Station St
- 144 E Chambord Ct
- 600 E Briarsprings Cir
- 8459 S 300 E
- 8264 S Resaca Dr Unit K9
- 8278 S Resaca Dr Unit L1
Your Personal Tour Guide
Ask me questions while you tour the home.