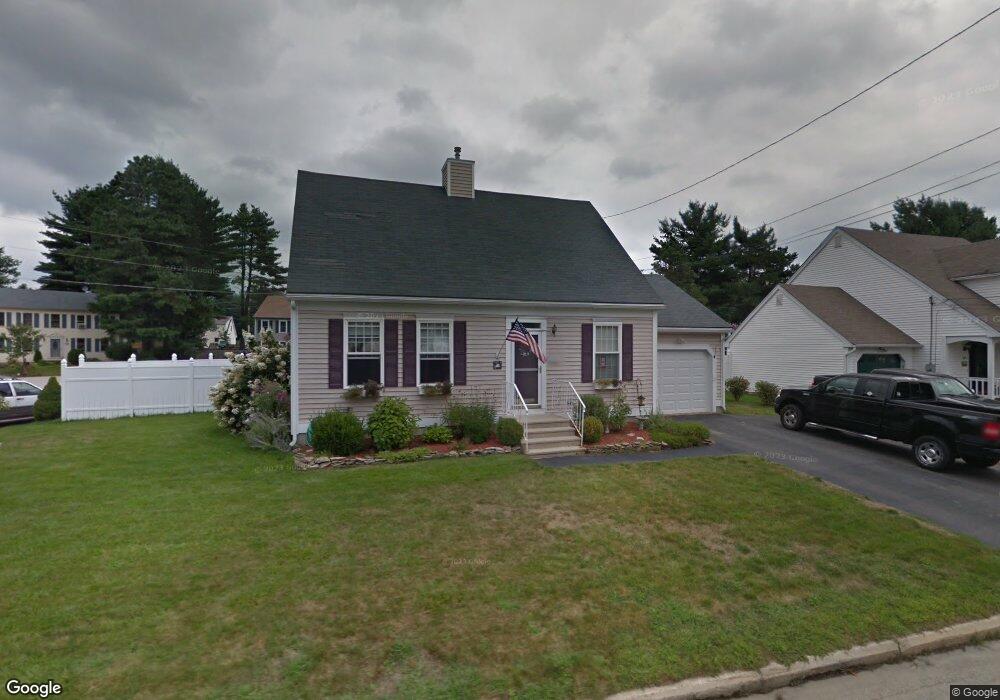
808 Brent St Manchester, NH 03103
Goffes Falls NeighborhoodEstimated Value: $510,000 - $586,000
3
Beds
2
Baths
1,666
Sq Ft
$326/Sq Ft
Est. Value
About This Home
This home is located at 808 Brent St, Manchester, NH 03103 and is currently estimated at $542,685, approximately $325 per square foot. 808 Brent St is a home located in Hillsborough County with nearby schools including Highland-Goffes Falls School, Southside Middle School, and Manchester Memorial High School.
Ownership History
Date
Name
Owned For
Owner Type
Purchase Details
Closed on
May 2, 2016
Sold by
Volght Nicole M
Bought by
Saunders Garret P and Saunders Amanda A
Current Estimated Value
Home Financials for this Owner
Home Financials are based on the most recent Mortgage that was taken out on this home.
Original Mortgage
$290,000
Outstanding Balance
$233,383
Interest Rate
4%
Mortgage Type
Adjustable Rate Mortgage/ARM
Estimated Equity
$309,302
Purchase Details
Closed on
Sep 30, 2003
Sold by
Leonard Christopher J and Leonard Jennifer J
Bought by
Gagnon Nicole M
Home Financials for this Owner
Home Financials are based on the most recent Mortgage that was taken out on this home.
Original Mortgage
$245,063
Interest Rate
6.29%
Purchase Details
Closed on
Jun 29, 2000
Sold by
Doshi Milan D and Doshi Manisha M
Bought by
Leonard Christopher J and Leonard Jennifer J
Purchase Details
Closed on
Jan 30, 1998
Sold by
Young Daryn S
Bought by
Doshi Milan D and Doshi Manisha M
Create a Home Valuation Report for This Property
The Home Valuation Report is an in-depth analysis detailing your home's value as well as a comparison with similar homes in the area
Home Values in the Area
Average Home Value in this Area
Purchase History
| Date | Buyer | Sale Price | Title Company |
|---|---|---|---|
| Saunders Garret P | $290,000 | -- | |
| Gagnon Nicole M | $247,000 | -- | |
| Leonard Christopher J | $151,000 | -- | |
| Doshi Milan D | $119,900 | -- |
Source: Public Records
Mortgage History
| Date | Status | Borrower | Loan Amount |
|---|---|---|---|
| Open | Saunders Garret P | $290,000 | |
| Previous Owner | Doshi Milan D | $210,652 | |
| Previous Owner | Doshi Milan D | $24,000 | |
| Previous Owner | Doshi Milan D | $245,063 |
Source: Public Records
Tax History Compared to Growth
Tax History
| Year | Tax Paid | Tax Assessment Tax Assessment Total Assessment is a certain percentage of the fair market value that is determined by local assessors to be the total taxable value of land and additions on the property. | Land | Improvement |
|---|---|---|---|---|
| 2024 | $6,863 | $350,500 | $95,100 | $255,400 |
| 2023 | $6,554 | $347,500 | $95,100 | $252,400 |
| 2022 | $6,338 | $347,500 | $95,100 | $252,400 |
| 2021 | $6,144 | $347,500 | $95,100 | $252,400 |
| 2020 | $5,805 | $235,400 | $65,500 | $169,900 |
| 2019 | $5,725 | $235,400 | $65,500 | $169,900 |
| 2018 | $5,574 | $235,400 | $65,500 | $169,900 |
| 2017 | $5,490 | $235,400 | $65,500 | $169,900 |
| 2016 | $5,447 | $235,400 | $65,500 | $169,900 |
| 2015 | $5,445 | $232,300 | $62,300 | $170,000 |
| 2014 | $5,459 | $232,300 | $62,300 | $170,000 |
| 2013 | $5,266 | $232,300 | $62,300 | $170,000 |
Source: Public Records
Map
Nearby Homes
- 15 Tamarack Ct
- 29 Watts Landing Unit 24
- 53 Pine Ave
- 67 Pullman St
- 8 Iroquois Cir
- 3-C Mustang Dr Unit MODEL
- 4543 Brown Ave
- 4481 Brown Ave
- 9 Mustang Dr Unit C
- 9 Mustang Dr Unit B
- 7 Mustang Dr Unit C
- 7 Mustang Dr Unit END UNIT-A
- 769 Daniel Webster Hwy
- 4243 Brown Ave
- 22 Kimberly Dr
- 490 Charles Bancroft Hwy
- 15 Harvey Rd
- 25 Chatfield Dr
- 34 Chatham Dr
- 29 Bedford Rd