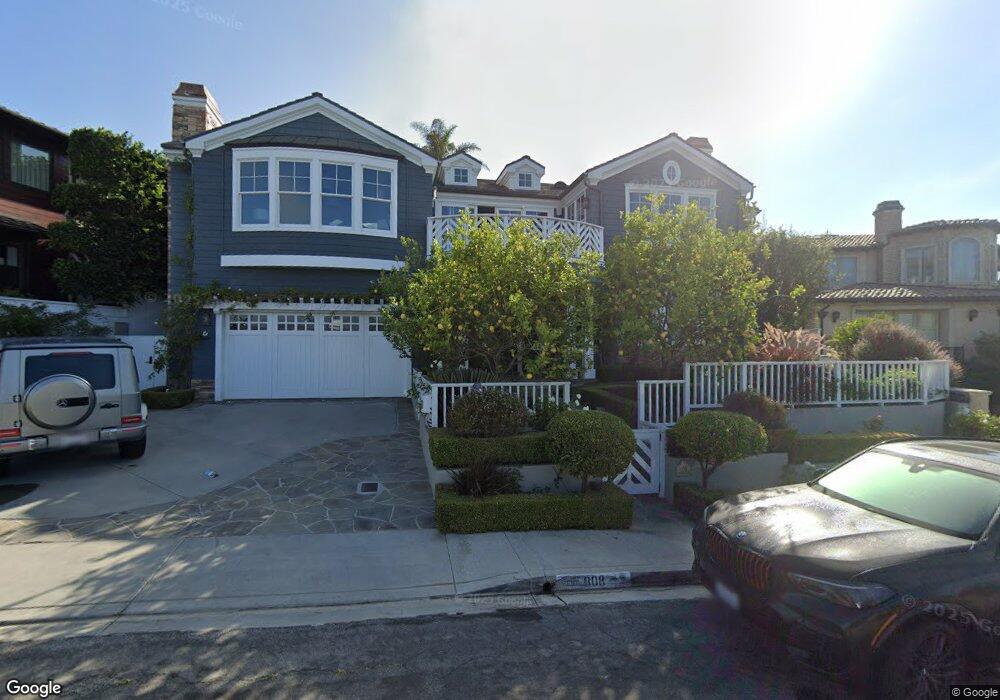
808 Highview Ave Manhattan Beach, CA 90266
Estimated Value: $7,480,000 - $8,093,000
5
Beds
3
Baths
4,501
Sq Ft
$1,712/Sq Ft
Est. Value
About This Home
This home is located at 808 Highview Ave, Manhattan Beach, CA 90266 and is currently estimated at $7,707,392, approximately $1,712 per square foot. 808 Highview Ave is a home located in Los Angeles County with nearby schools including Opal Robinson Elementary School, Manhattan Beach Middle School, and Mira Costa High School.
Ownership History
Date
Name
Owned For
Owner Type
Purchase Details
Closed on
Nov 4, 2016
Sold by
Worley Eric
Bought by
Worley Eric and Worley Cara
Current Estimated Value
Purchase Details
Closed on
Nov 17, 2008
Sold by
Nogawski John and Nogawski Melanie
Bought by
Worley Eric
Purchase Details
Closed on
May 29, 2002
Sold by
The Norrie Corp
Bought by
Nogawski John
Home Financials for this Owner
Home Financials are based on the most recent Mortgage that was taken out on this home.
Original Mortgage
$1,000,000
Interest Rate
6.28%
Purchase Details
Closed on
Oct 2, 2001
Sold by
Pozorski Edward G and Pozorski Eugenia B
Bought by
Norrie Corp
Home Financials for this Owner
Home Financials are based on the most recent Mortgage that was taken out on this home.
Original Mortgage
$830,000
Interest Rate
6.67%
Create a Home Valuation Report for This Property
The Home Valuation Report is an in-depth analysis detailing your home's value as well as a comparison with similar homes in the area
Home Values in the Area
Average Home Value in this Area
Purchase History
| Date | Buyer | Sale Price | Title Company |
|---|---|---|---|
| Worley Eric | -- | None Available | |
| Worley Eric | -- | None Available | |
| Worley Eric | $3,600,000 | Lawyers Title | |
| Nogawski John | $3,100,000 | Gateway Title Company | |
| Norrie Corp | $1,260,000 | Fidelity National Title Co |
Source: Public Records
Mortgage History
| Date | Status | Borrower | Loan Amount |
|---|---|---|---|
| Previous Owner | Nogawski John | $1,000,000 | |
| Previous Owner | Norrie Corp | $830,000 | |
| Closed | Nogawski John | $800,000 |
Source: Public Records
Tax History
| Year | Tax Paid | Tax Assessment Tax Assessment Total Assessment is a certain percentage of the fair market value that is determined by local assessors to be the total taxable value of land and additions on the property. | Land | Improvement |
|---|---|---|---|---|
| 2025 | $51,944 | $4,652,676 | $2,790,583 | $1,862,093 |
| 2024 | $51,944 | $4,561,448 | $2,735,866 | $1,825,582 |
| 2023 | $50,551 | $4,472,009 | $2,682,222 | $1,789,787 |
| 2022 | $49,672 | $4,384,324 | $2,629,630 | $1,754,694 |
| 2021 | $48,732 | $4,298,358 | $2,578,069 | $1,720,289 |
| 2019 | $47,251 | $4,155,868 | $2,501,603 | $1,654,265 |
| 2018 | $46,298 | $4,074,381 | $2,452,552 | $1,621,829 |
| 2016 | $43,274 | $3,916,169 | $2,357,317 | $1,558,852 |
| 2015 | $42,374 | $3,857,345 | $2,321,908 | $1,535,437 |
| 2014 | $37,765 | $3,416,000 | $2,056,200 | $1,359,800 |
Source: Public Records
Map
Nearby Homes
Your Personal Tour Guide
Ask me questions while you tour the home.