808 Leverenz Rd Unit 4 Naperville, IL 60565
Springbrook Prairie NeighborhoodEstimated Value: $863,251 - $913,000
Studio
1
Bath
3,125
Sq Ft
$285/Sq Ft
Est. Value
About This Home
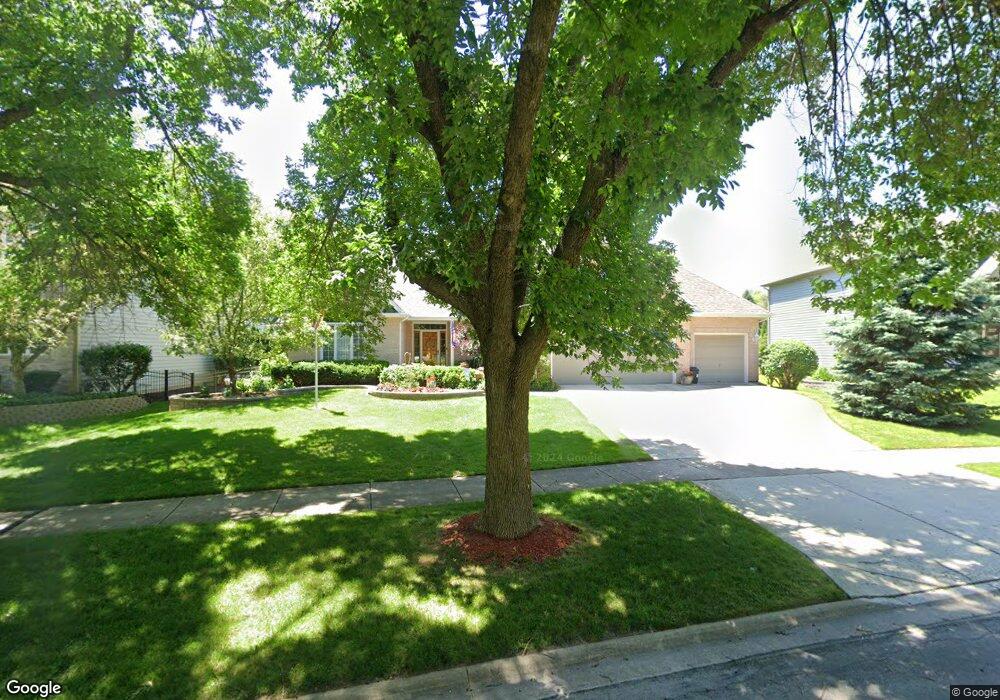
This home is located at 808 Leverenz Rd Unit 4, Naperville, IL 60565 and is currently estimated at $890,813, approximately $285 per square foot. 808 Leverenz Rd Unit 4 is a home located in Will County with nearby schools including Spring Brook Elementary School, Gordon Gregory Middle School, and Neuqua Valley High School.
Ownership History
Date
Name
Owned For
Owner Type
Purchase Details
Closed on
Dec 19, 2001
Sold by
Morton Willard C and Morton Jane A
Bought by
Althoetmar James P and Althoetmar Susan L
Current Estimated Value
Home Financials for this Owner
Home Financials are based on the most recent Mortgage that was taken out on this home.
Original Mortgage
$345,600
Outstanding Balance
$131,834
Interest Rate
6.25%
Estimated Equity
$758,979
Purchase Details
Closed on
Apr 12, 1994
Sold by
Olek Brothers Builders Inc
Bought by
Morton Willard C and Morton Jane A
Home Financials for this Owner
Home Financials are based on the most recent Mortgage that was taken out on this home.
Original Mortgage
$203,000
Interest Rate
7.35%
Purchase Details
Closed on
Jul 29, 1993
Sold by
Chicago Title & Trust Company
Bought by
Olek Brothers Builders Inc
Home Financials for this Owner
Home Financials are based on the most recent Mortgage that was taken out on this home.
Original Mortgage
$280,000
Interest Rate
7%
Create a Home Valuation Report for This Property
The Home Valuation Report is an in-depth analysis detailing your home's value as well as a comparison with similar homes in the area
Home Values in the Area
Average Home Value in this Area
Purchase History
| Date | Buyer | Sale Price | Title Company |
|---|---|---|---|
| Althoetmar James P | $432,000 | Chicago Title Insurance Co | |
| Morton Willard C | $315,000 | Chicago Title Insurance Co | |
| Olek Brothers Builders Inc | $85,500 | Chicago Title Insurance Co |
Source: Public Records
Mortgage History
| Date | Status | Borrower | Loan Amount |
|---|---|---|---|
| Open | Althoetmar James P | $345,600 | |
| Previous Owner | Morton Willard C | $203,000 | |
| Previous Owner | Olek Brothers Builders Inc | $280,000 |
Source: Public Records
Tax History
| Year | Tax Paid | Tax Assessment Tax Assessment Total Assessment is a certain percentage of the fair market value that is determined by local assessors to be the total taxable value of land and additions on the property. | Land | Improvement |
|---|---|---|---|---|
| 2024 | $13,642 | $224,282 | $54,739 | $169,543 |
| 2023 | $13,642 | $198,129 | $48,356 | $149,773 |
| 2022 | $13,291 | $194,447 | $45,744 | $148,703 |
| 2021 | $12,688 | $185,188 | $43,566 | $141,622 |
| 2020 | $12,442 | $182,254 | $42,876 | $139,378 |
| 2019 | $12,219 | $177,118 | $41,668 | $135,450 |
| 2018 | $11,959 | $170,647 | $40,751 | $129,896 |
| 2017 | $11,767 | $166,242 | $39,699 | $126,543 |
| 2016 | $11,738 | $162,663 | $38,844 | $123,819 |
| 2015 | $12,106 | $156,407 | $37,350 | $119,057 |
| 2014 | $12,106 | $155,757 | $37,350 | $118,407 |
| 2013 | $12,106 | $155,757 | $37,350 | $118,407 |
Source: Public Records
Map
Nearby Homes
- 1137 Crimson Ct
- 2715 Wendy Dr
- 2711 Wendy Dr
- 911 Rock Spring Rd
- 2627 Homestead Dr
- 1126 Starlite Ct
- 10S144 Ridge Rd
- 2347 Wilmington Ct
- 599 Hempstead Ave
- 2726 Seiler Dr Unit 2
- 1321 Galena Ct
- 2240 Mecan Dr
- 484 Blodgett Ct
- 820 Spring Creek Cir
- 2802 Wedgewood Dr
- 28W555 Leverenz Rd
- 719 Eagle Brook Ln Unit 4
- 28W587 Leverenz Rd
- 3520 Timber Creek Ln
- 3111 Landore Dr
- 812 Leverenz Rd
- 804 Leverenz Rd
- 2508 Swandyke Ct
- 904 Leverenz Rd
- 2512 Swandyke Ct
- 2504 Swandyke Ct
- 811 Leverenz Rd
- 807 Leverenz Rd
- 903 Leverenz Rd
- 908 Leverenz Rd
- 2420 Litchfield Ct
- 2604 Regency Ct
- 2515 Swandyke Ct
- 2416 Litchfield Ct
- 908 Gateshead Dr
- 916 Gateshead Dr
- 907 Leverenz Rd
- 2503 Swandyke Ct
- 912 Leverenz Rd
- 904 Gateshead Dr
Your Personal Tour Guide
Ask me questions while you tour the home.