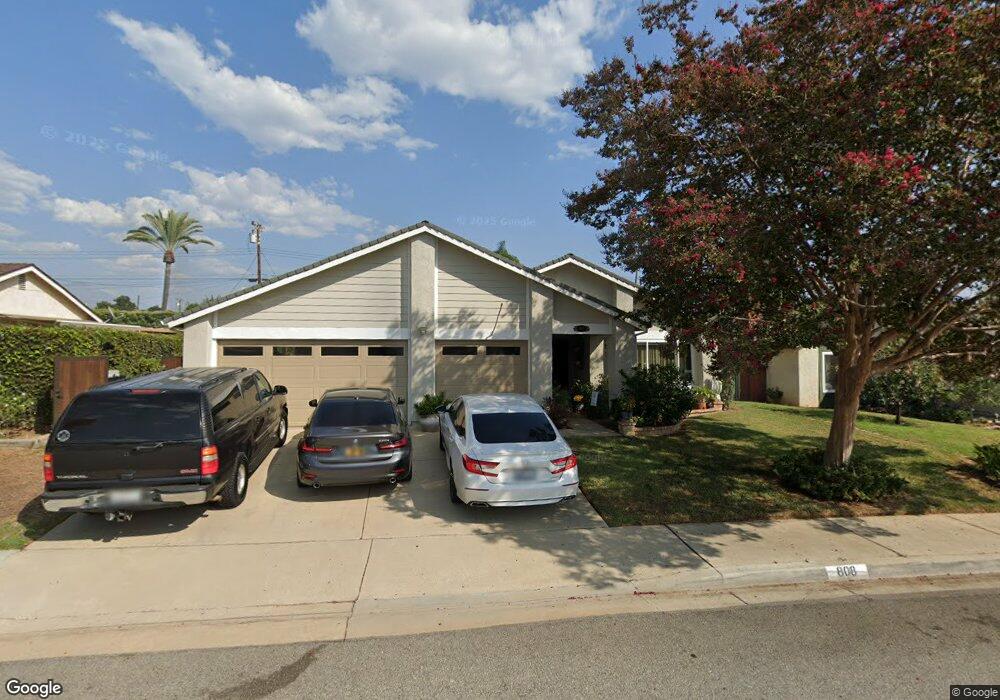
808 N Northcape Ave San Dimas, CA 91773
Estimated Value: $820,259 - $945,000
4
Beds
2
Baths
1,625
Sq Ft
$554/Sq Ft
Est. Value
About This Home
This home is located at 808 N Northcape Ave, San Dimas, CA 91773 and is currently estimated at $900,065, approximately $553 per square foot. 808 N Northcape Ave is a home located in Los Angeles County with nearby schools including Allen Avenue Elementary School, Lone Hill Middle School, and San Dimas High School.
Ownership History
Date
Name
Owned For
Owner Type
Purchase Details
Closed on
Dec 27, 1996
Sold by
James Philip T and James Marie T
Bought by
Mejia Miguel and Mejia Maria
Current Estimated Value
Home Financials for this Owner
Home Financials are based on the most recent Mortgage that was taken out on this home.
Original Mortgage
$193,700
Outstanding Balance
$15,977
Interest Rate
4.95%
Estimated Equity
$884,088
Create a Home Valuation Report for This Property
The Home Valuation Report is an in-depth analysis detailing your home's value as well as a comparison with similar homes in the area
Home Values in the Area
Average Home Value in this Area
Purchase History
| Date | Buyer | Sale Price | Title Company |
|---|---|---|---|
| Mejia Miguel | $215,500 | Title Land Company Inc |
Source: Public Records
Mortgage History
| Date | Status | Borrower | Loan Amount |
|---|---|---|---|
| Open | Mejia Miguel | $193,700 |
Source: Public Records
Tax History Compared to Growth
Tax History
| Year | Tax Paid | Tax Assessment Tax Assessment Total Assessment is a certain percentage of the fair market value that is determined by local assessors to be the total taxable value of land and additions on the property. | Land | Improvement |
|---|---|---|---|---|
| 2025 | $4,487 | $350,960 | $120,185 | $230,775 |
| 2024 | $4,487 | $344,079 | $117,829 | $226,250 |
| 2023 | $4,387 | $337,333 | $115,519 | $221,814 |
| 2022 | $4,313 | $330,719 | $113,254 | $217,465 |
| 2021 | $4,224 | $324,235 | $111,034 | $213,201 |
| 2019 | $4,142 | $314,620 | $107,742 | $206,878 |
| 2018 | $3,888 | $308,452 | $105,630 | $202,822 |
| 2016 | $3,733 | $296,477 | $101,529 | $194,948 |
| 2015 | $3,675 | $292,024 | $100,004 | $192,020 |
| 2014 | $3,644 | $286,305 | $98,046 | $188,259 |
Source: Public Records
Map
Nearby Homes
- 750 N Northcape Ave
- 422 E Payson St
- 562 E Allen Ave
- 953 Alleghany Cir
- 629 Calaveras Rd
- 610 E Payson St
- 727 Glenlea St
- 1136 Cherokee Ct
- 208 E 3rd St
- 761 Fordland Ave
- 0 Dallas Rd Unit WS25141209
- 555 Canyon Hill Rd
- 4575 Ramona Ave Unit 16
- 4545 Ramona Ave Unit 9
- 4565 Ramona Ave Unit 4
- 2737 Pattiglen Ave
- 230 W 2nd St
- 409 W 4th St
- 237 Maverick Dr
- 1287 Whisperglen Ln
- 800 N Northcape Ave
- 816 N Northcape Ave
- 813 N Oceanbluff Ave
- 803 N Oceanbluff Ave
- 780 N Northcape Ave
- 355 Flagstaff St
- 824 N Northcape Ave
- 777 N Oceanbluff Ave
- 825 N Oceanbluff Ave
- 811 N Northcape Ave
- 770 N Northcape Ave
- 345 Flagstaff St
- 832 N Northcape Ave
- 769 N Oceanbluff Ave
- 831 N Northcape Ave
- 350 Flagstaff St
- 821 N Northcape Ave
- 808 N Oceanbluff Ave
- 816 N Oceanbluff Ave
- 758 N Northcape Ave