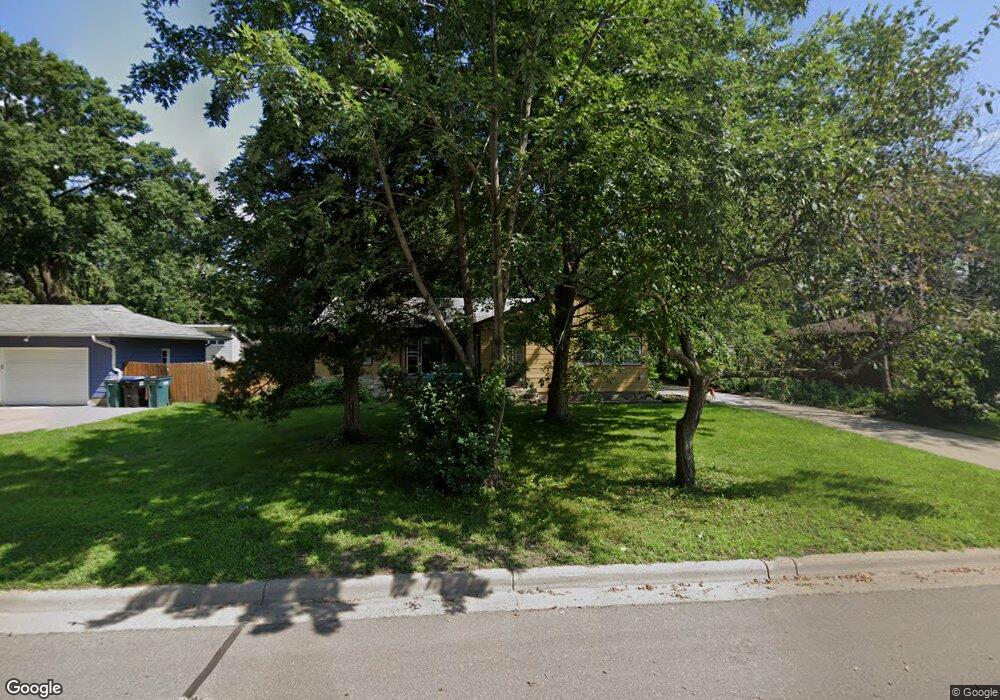
809 Cope Ave W Saint Paul, MN 55113
Central Park NeighborhoodEstimated Value: $333,000 - $347,000
3
Beds
1
Bath
1,572
Sq Ft
$216/Sq Ft
Est. Value
About This Home
This home is located at 809 Cope Ave W, Saint Paul, MN 55113 and is currently estimated at $340,278, approximately $216 per square foot. 809 Cope Ave W is a home located in Ramsey County with nearby schools including Central Park Elementary School, Roseville Area Middle School, and Roseville Area Senior High School.
Ownership History
Date
Name
Owned For
Owner Type
Purchase Details
Closed on
Jun 3, 2022
Sold by
Hunt Christopher
Bought by
Shatek Krystal
Current Estimated Value
Home Financials for this Owner
Home Financials are based on the most recent Mortgage that was taken out on this home.
Original Mortgage
$282,747
Outstanding Balance
$269,438
Interest Rate
5.11%
Mortgage Type
New Conventional
Estimated Equity
$74,666
Purchase Details
Closed on
May 23, 2022
Sold by
Christopher Hunt
Bought by
Shatek Krystal
Home Financials for this Owner
Home Financials are based on the most recent Mortgage that was taken out on this home.
Original Mortgage
$282,747
Outstanding Balance
$269,438
Interest Rate
5.11%
Mortgage Type
New Conventional
Estimated Equity
$74,666
Purchase Details
Closed on
Jul 6, 2001
Sold by
Oneil Susan E
Bought by
Hunt Christopher
Purchase Details
Closed on
Sep 30, 1999
Sold by
Boll Roberta J and Boll Lawrence J
Bought by
Oneil Susan E
Create a Home Valuation Report for This Property
The Home Valuation Report is an in-depth analysis detailing your home's value as well as a comparison with similar homes in the area
Home Values in the Area
Average Home Value in this Area
Purchase History
| Date | Buyer | Sale Price | Title Company |
|---|---|---|---|
| Shatek Krystal | $290,000 | -- | |
| Shatek Krystal | $290,000 | Minnesota Title | |
| Hunt Christopher | $164,000 | -- | |
| Hunt Christopher | $164,000 | -- | |
| Oneil Susan E | $140,500 | -- |
Source: Public Records
Mortgage History
| Date | Status | Borrower | Loan Amount |
|---|---|---|---|
| Open | Shatek Krystal | $282,747 | |
| Closed | Shatek Krystal | $284,747 | |
| Closed | Shatek Krystal | $284,747 |
Source: Public Records
Tax History Compared to Growth
Tax History
| Year | Tax Paid | Tax Assessment Tax Assessment Total Assessment is a certain percentage of the fair market value that is determined by local assessors to be the total taxable value of land and additions on the property. | Land | Improvement |
|---|---|---|---|---|
| 2025 | $4,252 | $311,800 | $75,000 | $236,800 |
| 2023 | $4,252 | $280,800 | $67,500 | $213,300 |
| 2022 | $2,766 | $216,700 | $67,500 | $149,200 |
| 2021 | $2,336 | $198,600 | $67,500 | $131,100 |
| 2020 | $2,434 | $182,900 | $60,000 | $122,900 |
| 2019 | $2,312 | $178,900 | $60,000 | $118,900 |
| 2018 | $2,734 | $167,100 | $58,200 | $108,900 |
| 2017 | $2,202 | $187,800 | $58,200 | $129,600 |
| 2016 | $2,260 | $0 | $0 | $0 |
| 2015 | $2,550 | $159,500 | $54,600 | $104,900 |
| 2014 | $2,418 | $0 | $0 | $0 |
Source: Public Records
Map
Nearby Homes
- 2817 Victoria St N
- 2850 Victoria St N
- 888 Highway 36 W
- 752 Sherren St W
- 719 Grandview Ave W
- 815 Sandhurst Dr W
- 630 Lovell Ave W
- 1075 Sherren St W
- 1008 Burke Ave W
- 518 Lovell Ave W Unit 2
- 2416 Lexington Ave N
- 204X Eldridge Ave W
- 708 Skillman Ave W
- 700 Skillman Ave W
- 707 Shryer Ave W
- 500 County Road B W Unit 309
- 667 County Road C W
- 2670 Oxford St N Unit 246
- 2680 N Oxford St Unit 109
- 1031 Ryan Ave W
- 815 Cope Ave W
- 803 Cope Ave W
- 812 Lovell Ave W
- 823 Cope Ave W
- 820 Lovell Ave W
- 802 Lovell Ave W
- 795 Cope Ave W
- 826 Lovell Ave W
- 794 Lovell Ave W
- 831 Cope Ave W
- 787 Cope Ave W
- 832 Lovell Ave W
- 786 Lovell Ave W
- 841 Cope Ave W
- 809 Lovell Ave W
- 801 Lovell Ave W
- 815 Lovell Ave W
- 842 Lovell Ave W
- 777 Cope Ave W
- 823 Lovell Ave W