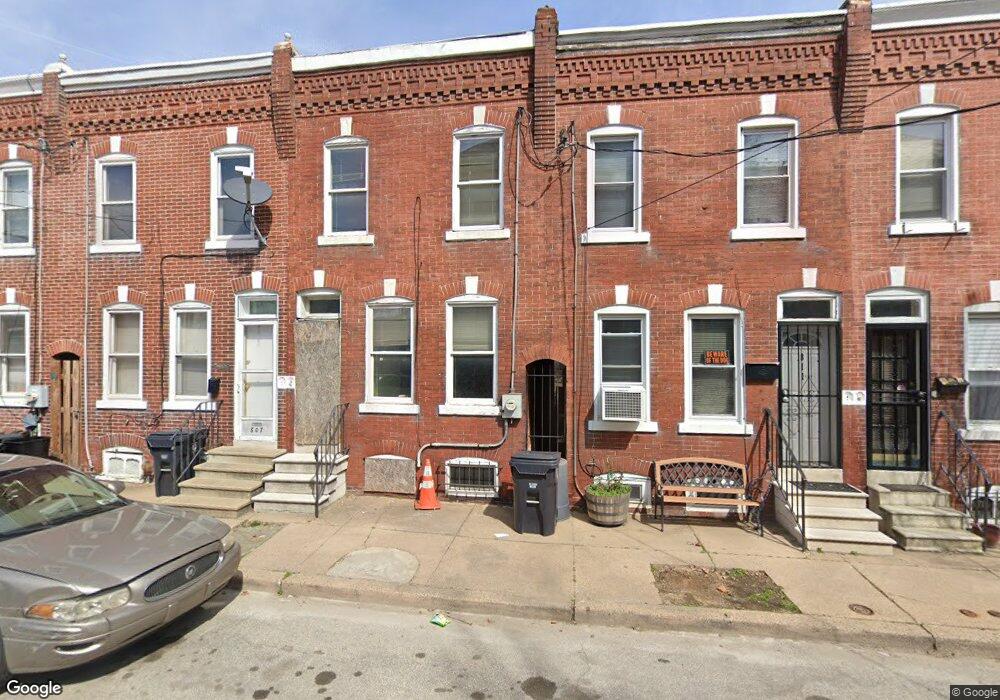
809 E 7th St Wilmington, DE 19801
Downtown Wilmington NeighborhoodEstimated Value: $124,624 - $161,000
3
Beds
1
Bath
1,025
Sq Ft
$140/Sq Ft
Est. Value
About This Home
This home is located at 809 E 7th St, Wilmington, DE 19801 and is currently estimated at $143,406, approximately $139 per square foot. 809 E 7th St is a home located in New Castle County with nearby schools including The Bancroft School, The Bayard School, and Newark High School.
Ownership History
Date
Name
Owned For
Owner Type
Purchase Details
Closed on
Dec 16, 2021
Sold by
Inter Neighborhood Cmnty Builders Llc
Bought by
Eastside Housing Partners Llc
Current Estimated Value
Home Financials for this Owner
Home Financials are based on the most recent Mortgage that was taken out on this home.
Original Mortgage
$836,000
Outstanding Balance
$767,553
Interest Rate
2.98%
Mortgage Type
Purchase Money Mortgage
Estimated Equity
-$624,147
Purchase Details
Closed on
Apr 16, 2020
Sold by
Wilmington Neighborhood Conservancy Land
Bought by
Inter Neighborhood Cmnty Builders Llc
Purchase Details
Closed on
Mar 30, 2020
Sold by
City Of Wilmington
Bought by
Wilmington Conservatory Land Bank Corp
Purchase Details
Closed on
Jul 31, 2018
Sold by
Estate Of Lacy Compton
Bought by
City Of Wilmington
Create a Home Valuation Report for This Property
The Home Valuation Report is an in-depth analysis detailing your home's value as well as a comparison with similar homes in the area
Home Values in the Area
Average Home Value in this Area
Purchase History
| Date | Buyer | Sale Price | Title Company |
|---|---|---|---|
| Eastside Housing Partners Llc | -- | None Available | |
| Inter Neighborhood Cmnty Builders Llc | -- | None Available | |
| Wilmington Conservatory Land Bank Corp | -- | None Available | |
| City Of Wilmington | $13,000 | None Available |
Source: Public Records
Mortgage History
| Date | Status | Borrower | Loan Amount |
|---|---|---|---|
| Open | Eastside Housing Partners Llc | $836,000 |
Source: Public Records
Tax History Compared to Growth
Tax History
| Year | Tax Paid | Tax Assessment Tax Assessment Total Assessment is a certain percentage of the fair market value that is determined by local assessors to be the total taxable value of land and additions on the property. | Land | Improvement |
|---|---|---|---|---|
| 2024 | $383 | $10,400 | $2,500 | $7,900 |
| 2023 | $374 | $10,400 | $2,500 | $7,900 |
| 2022 | $370 | $10,400 | $2,500 | $7,900 |
| 2021 | $4 | $10,400 | $2,500 | $7,900 |
| 2020 | $350 | $10,400 | $2,500 | $7,900 |
| 2019 | $207 | $10,400 | $2,500 | $7,900 |
| 2018 | $992 | $10,400 | $2,500 | $7,900 |
| 2017 | $482 | $10,400 | $2,500 | $7,900 |
| 2016 | $482 | $10,400 | $2,500 | $7,900 |
| 2015 | $452 | $10,400 | $2,500 | $7,900 |
| 2014 | $452 | $10,400 | $2,500 | $7,900 |
Source: Public Records
Map
Nearby Homes