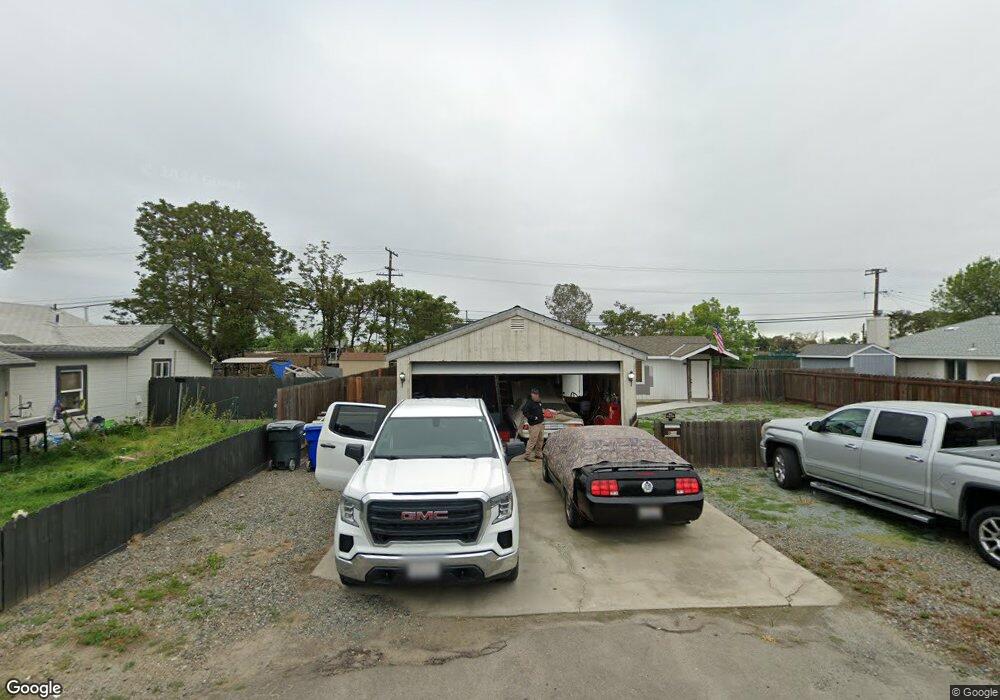
809 E Ivy St Hanford, CA 93230
Estimated Value: $311,000 - $366,000
3
Beds
2
Baths
1,530
Sq Ft
$217/Sq Ft
Est. Value
About This Home
This home is located at 809 E Ivy St, Hanford, CA 93230 and is currently estimated at $331,646, approximately $216 per square foot. 809 E Ivy St is a home located in Kings County with nearby schools including Lee Richmond Elementary School, John F. Kennedy Junior High School, and Hanford High School.
Ownership History
Date
Name
Owned For
Owner Type
Purchase Details
Closed on
May 11, 2017
Sold by
Kelley Ryan D and Kelley Ryan
Bought by
Kelley Ryan D
Current Estimated Value
Home Financials for this Owner
Home Financials are based on the most recent Mortgage that was taken out on this home.
Original Mortgage
$102,500
Outstanding Balance
$69,716
Interest Rate
4.14%
Mortgage Type
New Conventional
Estimated Equity
$261,930
Purchase Details
Closed on
Nov 1, 2004
Sold by
Jones Calvin
Bought by
Kelley Ryan
Purchase Details
Closed on
Jan 28, 2003
Sold by
Jones Shirley
Bought by
Jones Calvin
Home Financials for this Owner
Home Financials are based on the most recent Mortgage that was taken out on this home.
Original Mortgage
$54,150
Interest Rate
5.79%
Mortgage Type
FHA
Purchase Details
Closed on
Dec 9, 2002
Sold by
Vetter Errol
Bought by
Kelleya Ryan and Jones Calvin
Home Financials for this Owner
Home Financials are based on the most recent Mortgage that was taken out on this home.
Original Mortgage
$54,150
Interest Rate
5.79%
Mortgage Type
FHA
Purchase Details
Closed on
Dec 20, 1999
Sold by
Mudd Ruth E
Bought by
Vetter Errol
Home Financials for this Owner
Home Financials are based on the most recent Mortgage that was taken out on this home.
Original Mortgage
$30,210
Interest Rate
7.84%
Create a Home Valuation Report for This Property
The Home Valuation Report is an in-depth analysis detailing your home's value as well as a comparison with similar homes in the area
Home Values in the Area
Average Home Value in this Area
Purchase History
| Date | Buyer | Sale Price | Title Company |
|---|---|---|---|
| Kelley Ryan D | -- | First American Title Company | |
| Kelley Ryan | -- | -- | |
| Jones Calvin | -- | Hanford Title Company | |
| Kelleya Ryan | $43,000 | Hanford Title Company | |
| Vetter Errol | $38,000 | First American Title Co |
Source: Public Records
Mortgage History
| Date | Status | Borrower | Loan Amount |
|---|---|---|---|
| Open | Kelley Ryan D | $102,500 | |
| Previous Owner | Kelleya Ryan | $54,150 | |
| Previous Owner | Vetter Errol | $30,210 |
Source: Public Records
Tax History
| Year | Tax Paid | Tax Assessment Tax Assessment Total Assessment is a certain percentage of the fair market value that is determined by local assessors to be the total taxable value of land and additions on the property. | Land | Improvement |
|---|---|---|---|---|
| 2025 | $1,746 | $171,702 | $67,615 | $104,087 |
| 2023 | $1,746 | $165,038 | $64,991 | $100,047 |
| 2022 | $1,787 | $161,803 | $63,717 | $98,086 |
| 2021 | $1,749 | $158,631 | $62,468 | $96,163 |
| 2020 | $1,766 | $157,004 | $61,827 | $95,177 |
| 2019 | $1,736 | $153,926 | $60,615 | $93,311 |
| 2018 | $1,687 | $150,907 | $59,426 | $91,481 |
| 2017 | $1,661 | $147,948 | $58,261 | $89,687 |
| 2016 | $1,639 | $145,047 | $57,119 | $87,928 |
| 2015 | $1,628 | $142,868 | $56,261 | $86,607 |
| 2014 | $1,596 | $140,069 | $55,159 | $84,910 |
Source: Public Records
Map
Nearby Homes
Your Personal Tour Guide
Ask me questions while you tour the home.