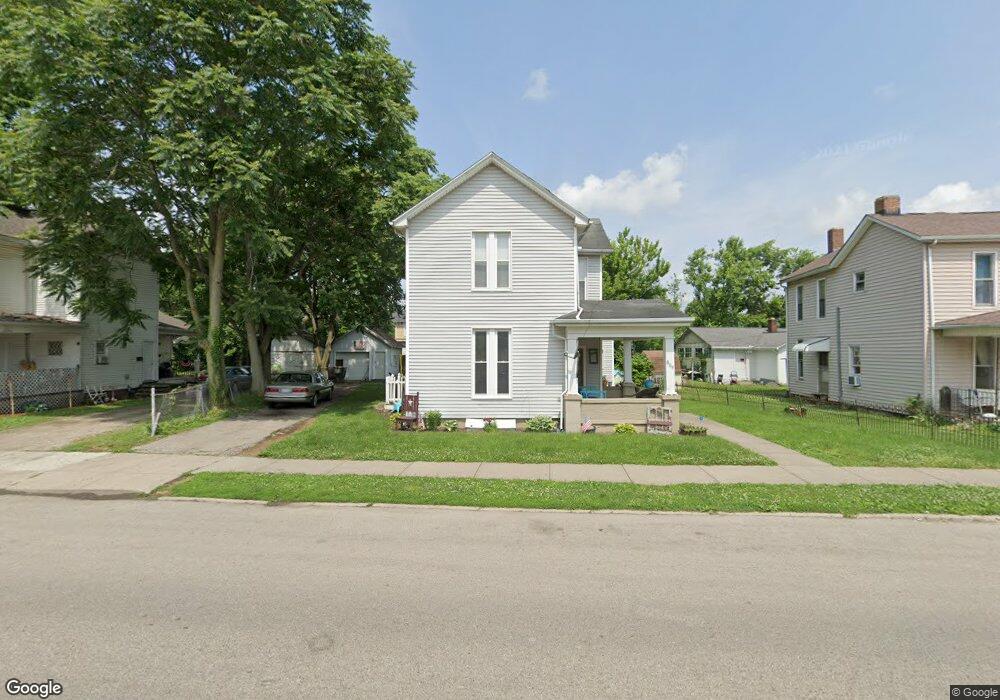
809 S Main St Franklin, OH 45005
Estimated Value: $144,144 - $182,000
3
Beds
2
Baths
1,526
Sq Ft
$109/Sq Ft
Est. Value
About This Home
This home is located at 809 S Main St, Franklin, OH 45005 and is currently estimated at $166,536, approximately $109 per square foot. 809 S Main St is a home located in Warren County with nearby schools including Franklin High School.
Ownership History
Date
Name
Owned For
Owner Type
Purchase Details
Closed on
Aug 20, 2015
Sold by
Estes Claudia J and Estes Billy D
Bought by
Estes Billy D
Current Estimated Value
Purchase Details
Closed on
Mar 24, 1993
Sold by
Riddell Donna and Riddell Donna
Bought by
Estes and Estes Billy D
Purchase Details
Closed on
Oct 12, 1990
Sold by
Riddell Riddell and Riddell Gary L
Bought by
Riddell Riddell and Riddell Donna
Purchase Details
Closed on
Dec 11, 1989
Sold by
Riddell Helen and Riddell Robert
Bought by
Riddell and Riddell Gary L
Purchase Details
Closed on
May 18, 1989
Sold by
Riddell Paul M and Riddell Helen
Bought by
Helen Riddell and Helen Helen
Create a Home Valuation Report for This Property
The Home Valuation Report is an in-depth analysis detailing your home's value as well as a comparison with similar homes in the area
Home Values in the Area
Average Home Value in this Area
Purchase History
| Date | Buyer | Sale Price | Title Company |
|---|---|---|---|
| Estes Billy D | -- | Attorney | |
| Estes | $43,000 | -- | |
| Riddell Riddell | -- | -- | |
| Riddell | -- | -- | |
| Helen Riddell | -- | -- |
Source: Public Records
Tax History
| Year | Tax Paid | Tax Assessment Tax Assessment Total Assessment is a certain percentage of the fair market value that is determined by local assessors to be the total taxable value of land and additions on the property. | Land | Improvement |
|---|---|---|---|---|
| 2025 | $1,519 | $31,580 | $10,100 | $21,480 |
| 2024 | $1,519 | $31,580 | $10,100 | $21,480 |
| 2023 | $1,252 | $23,348 | $5,726 | $17,622 |
| 2022 | $1,228 | $23,349 | $5,726 | $17,623 |
| 2021 | $1,164 | $23,349 | $5,726 | $17,623 |
| 2020 | $1,047 | $18,533 | $4,547 | $13,986 |
| 2019 | $955 | $18,533 | $4,547 | $13,986 |
| 2018 | $942 | $18,533 | $4,547 | $13,986 |
| 2017 | $988 | $17,535 | $4,365 | $13,171 |
| 2016 | $1,007 | $17,535 | $4,365 | $13,171 |
| 2015 | $504 | $17,535 | $4,365 | $13,171 |
| 2014 | $517 | $17,540 | $4,360 | $13,170 |
| 2013 | $880 | $20,290 | $5,050 | $15,240 |
Source: Public Records
Map
Nearby Homes
Your Personal Tour Guide
Ask me questions while you tour the home.