Estimated Value: $394,000 - $602,000
5
Beds
4
Baths
2,187
Sq Ft
$233/Sq Ft
Est. Value
About This Home
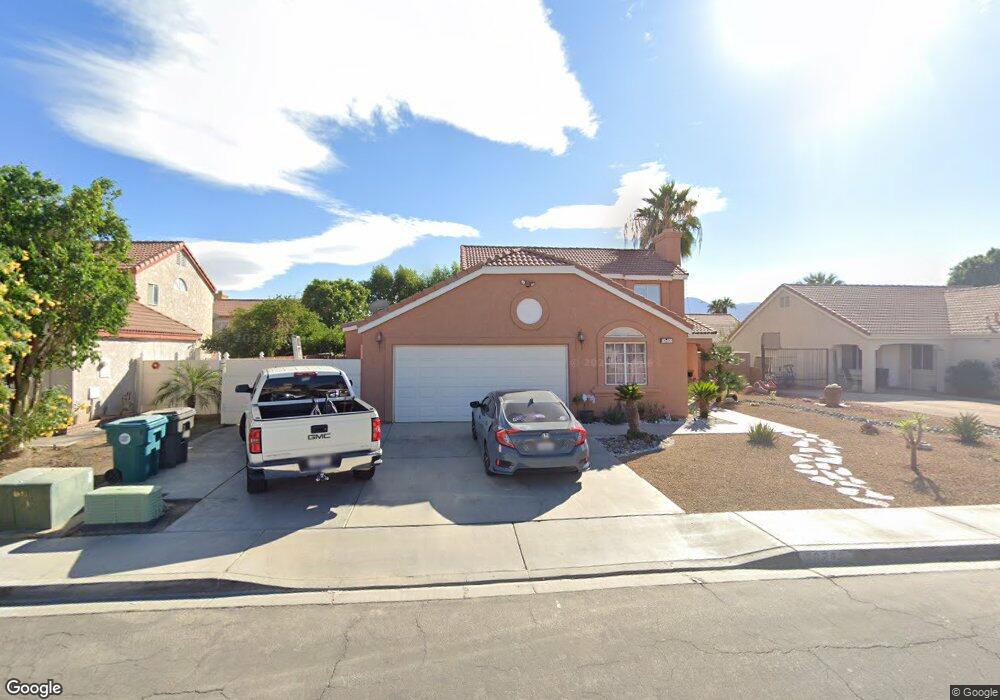
This home is located at 80929 Shenandoah Ave, Indio, CA 92201 and is currently estimated at $510,372, approximately $233 per square foot. 80929 Shenandoah Ave is a home located in Riverside County with nearby schools including James Madison Elementary School, Indio Middle School, and Indio High School.
Ownership History
Date
Name
Owned For
Owner Type
Purchase Details
Closed on
Feb 22, 2025
Sold by
Favela Abel and Favela Manuela O
Bought by
Abel And Manuela Favela Family Trust and Favela
Current Estimated Value
Purchase Details
Closed on
Apr 16, 1997
Sold by
Favela Abel and Bernal Manuela O
Bought by
Favela Abel and Favela Manuela O
Home Financials for this Owner
Home Financials are based on the most recent Mortgage that was taken out on this home.
Original Mortgage
$82,422
Interest Rate
7.96%
Mortgage Type
FHA
Purchase Details
Closed on
Mar 10, 1995
Sold by
Hud
Bought by
Favela Abel G and Bernal Manuela O
Home Financials for this Owner
Home Financials are based on the most recent Mortgage that was taken out on this home.
Original Mortgage
$83,436
Interest Rate
8.9%
Mortgage Type
FHA
Purchase Details
Closed on
Feb 18, 1994
Sold by
Midfirst S & L Assn
Bought by
Hud
Purchase Details
Closed on
Feb 16, 1994
Sold by
Cal Western Reconveyance Corp
Bought by
Midfirst S and Midfirst L
Create a Home Valuation Report for This Property
The Home Valuation Report is an in-depth analysis detailing your home's value as well as a comparison with similar homes in the area
Home Values in the Area
Average Home Value in this Area
Purchase History
| Date | Buyer | Sale Price | Title Company |
|---|---|---|---|
| Abel And Manuela Favela Family Trust | -- | None Listed On Document | |
| Favela Abel | -- | Northern Counties Title | |
| Favela Abel G | $85,000 | Continental Lawyers Title Co | |
| Hud | -- | Fidelity National Title Ins | |
| Midfirst S | $115,702 | Stewart Title Co |
Source: Public Records
Mortgage History
| Date | Status | Borrower | Loan Amount |
|---|---|---|---|
| Previous Owner | Favela Abel | $82,422 | |
| Previous Owner | Favela Abel G | $83,436 |
Source: Public Records
Tax History
| Year | Tax Paid | Tax Assessment Tax Assessment Total Assessment is a certain percentage of the fair market value that is determined by local assessors to be the total taxable value of land and additions on the property. | Land | Improvement |
|---|---|---|---|---|
| 2025 | $3,155 | $181,168 | $33,571 | $147,597 |
| 2023 | $3,155 | $174,134 | $32,268 | $141,866 |
| 2022 | $2,964 | $170,721 | $31,636 | $139,085 |
| 2021 | $2,915 | $167,374 | $31,016 | $136,358 |
| 2020 | $2,588 | $165,658 | $30,698 | $134,960 |
| 2019 | $2,521 | $162,411 | $30,097 | $132,314 |
| 2018 | $2,459 | $159,227 | $29,508 | $129,719 |
| 2017 | $2,417 | $156,106 | $28,930 | $127,176 |
| 2016 | $2,376 | $153,046 | $28,363 | $124,683 |
| 2015 | $2,341 | $150,749 | $27,938 | $122,811 |
| 2014 | $2,306 | $147,798 | $27,392 | $120,406 |
Source: Public Records
Map
Nearby Homes
- 80940 Shenandoah Ave
- 45640 Cimarron Rd
- 80957 Rio Grande Ave
- 81033 Jamie Way
- 45350 Palmwood Dr
- 80928 Brown St
- 45882 Coco Palm Dr
- 45210 Palmwood Dr
- 80634 Princeton Ave
- 80878 Amherst Ave
- 81253 Coco Palm Dr
- 45254 Crystal Springs Dr
- 46482 Jasmine Ln
- 81038 Helen Ave
- 80870 California 111 Unit 128
- 80870 California 111 Unit 147
- 80870 California 111 Unit 151
- 80870 California 111 Unit 122
- 80870 California 111 Unit 124
- 80870 California 111 Unit 5
- 80917 Shenandoah Ave
- 80941 Shenandoah Ave
- 80928 Rio Grande Ave
- 80916 Rio Grande Ave
- 80940 Rio Grande Ave
- 80903 Shenandoah Ave
- 80957 Shenandoah Ave
- 80928 Shenandoah Ave
- 80916 Shenandoah Ave
- 80902 Rio Grande Ave
- 80956 Rio Grande Ave
- 80902 Shenandoah Ave
- 80887 Shenandoah Ave
- 80956 Shenandoah Ave
- 80886 Rio Grande Ave
- 80929 Mississippi Rd
- 80886 Shenandoah Ave
- 80929 Rio Grande Ave
- 80917 Mississippi Ave
- 80917 Mississippi Rd
Your Personal Tour Guide
Ask me questions while you tour the home.