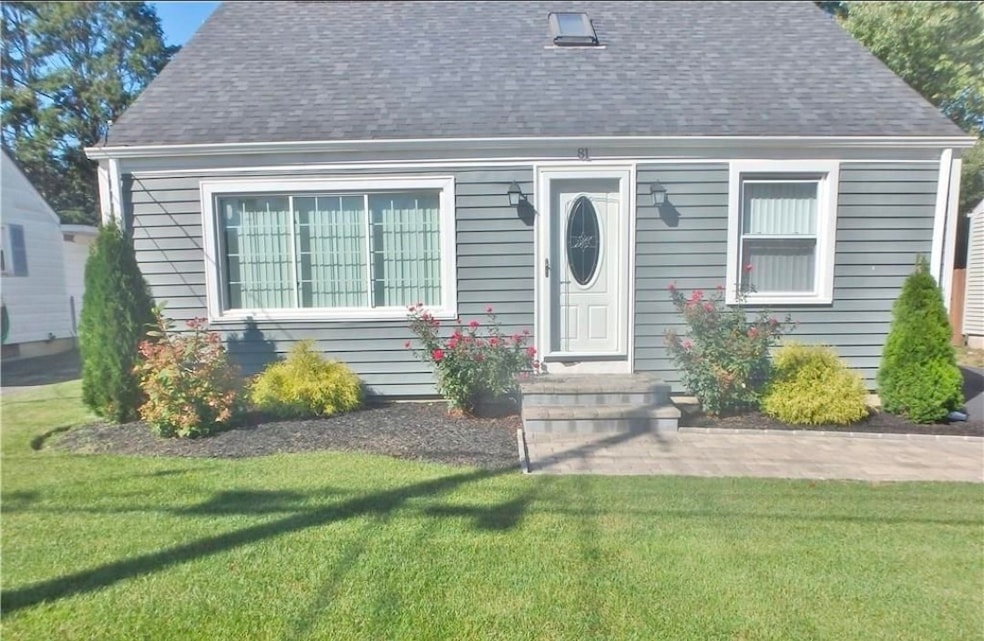
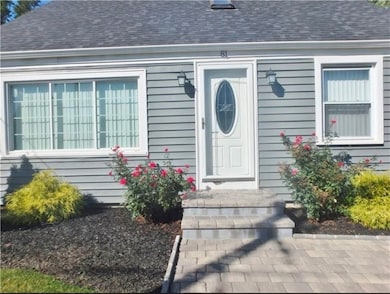
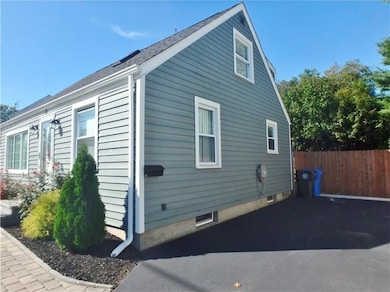
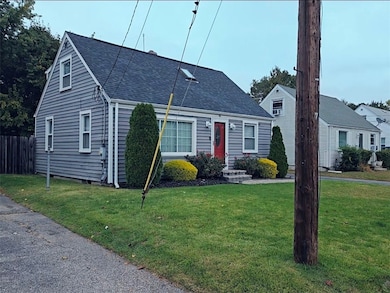

81 Allen Ave Cranston, RI 02910
Eden Park NeighborhoodEstimated payment $2,674/month
Highlights
- Golf Course Community
- Deck
- Laundry Room
- Cape Cod Architecture
- Wood Flooring
- Public Transportation
About This Home
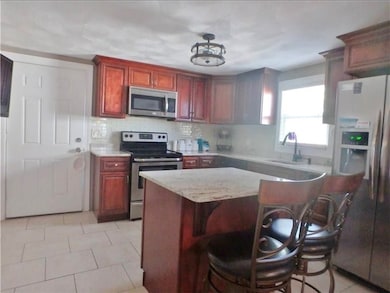
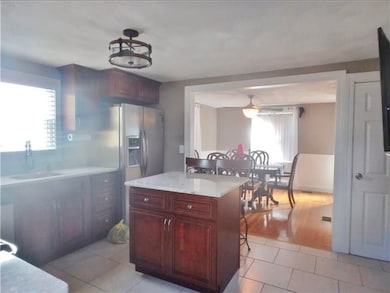
MOTIVATED SELLER!! Charming Move-In Ready Home in Quiet Cranston Neighborhood. Welcome to this beautifully maintained 3-bedroom, 2.5-bathroom home located in a peaceful and sought-after neighborhood of Cranston. This property offers a comfortable layout featuring a bright living room, formal dining room, and eat-in kitchen perfect for everyday living and entertaining. Enjoy the added space of a fully finished basement, along with a dedicated laundry room and plenty of room for a home office, gym, or recreation area. The home also includes central air, a newer roof, and is truly move-in ready. Step outside to a clean, fully fenced backyard ideal for gatherings, pets, or simply relaxing outdoors. Conveniently located just minutes from major highways, schools, Garden City Shopping Center, restaurants, the airport, banks, hospitals, pharmacies, and more. Contingent on seller finding suitable housing. However, seller is currently under contract at the new place. Don't miss your chance to own this wonderful home in a prime location schedule your private showing today!
Home Details
Home Type
- Single Family
Est. Annual Taxes
- $4,529
Year Built
- Built in 1949
Lot Details
- 4,792 Sq Ft Lot
- Sprinkler System
Home Design
- Cape Cod Architecture
- Vinyl Siding
- Concrete Perimeter Foundation
Interior Spaces
- 2-Story Property
- Family Room
- Utility Room
Kitchen
- Oven
- Range
- Microwave
- Dishwasher
Flooring
- Wood
- Ceramic Tile
Bedrooms and Bathrooms
- 3 Bedrooms
Laundry
- Laundry Room
- Dryer
- Washer
Finished Basement
- Basement Fills Entire Space Under The House
- Interior Basement Entry
Parking
- 4 Parking Spaces
- No Garage
Utilities
- Central Heating and Cooling System
- Heating System Uses Gas
- 200+ Amp Service
- Gas Water Heater
Additional Features
- Deck
- Property near a hospital
Listing and Financial Details
- Assessor Parcel Number 81ALLENAVCRAN
Community Details
Amenities
- Shops
- Restaurant
- Public Transportation
Recreation
- Golf Course Community
Map
Home Values in the Area
Average Home Value in this Area
Tax History
| Year | Tax Paid | Tax Assessment Tax Assessment Total Assessment is a certain percentage of the fair market value that is determined by local assessors to be the total taxable value of land and additions on the property. | Land | Improvement |
|---|---|---|---|---|
| 2025 | $4,529 | $326,300 | $106,200 | $220,100 |
| 2024 | $4,441 | $326,300 | $106,200 | $220,100 |
| 2023 | $4,179 | $221,100 | $69,900 | $151,200 |
| 2022 | $4,093 | $221,100 | $69,900 | $151,200 |
| 2021 | $3,980 | $221,100 | $69,900 | $151,200 |
| 2020 | $3,772 | $181,600 | $66,600 | $115,000 |
| 2019 | $3,772 | $181,600 | $66,600 | $115,000 |
| 2018 | $3,685 | $181,600 | $66,600 | $115,000 |
| 2017 | $3,450 | $150,400 | $59,900 | $90,500 |
| 2016 | $3,376 | $150,400 | $59,900 | $90,500 |
| 2015 | $3,376 | $150,400 | $59,900 | $90,500 |
| 2014 | $3,332 | $145,900 | $59,900 | $86,000 |
Property History
| Date | Event | Price | List to Sale | Price per Sq Ft |
|---|---|---|---|---|
| 11/04/2025 11/04/25 | Pending | -- | -- | -- |
| 10/29/2025 10/29/25 | For Sale | $434,999 | -- | $284 / Sq Ft |
Purchase History
| Date | Type | Sale Price | Title Company |
|---|---|---|---|
| Warranty Deed | $128,000 | -- | |
| Deed | $87,000 | -- | |
| Foreclosure Deed | $125,628 | -- |
Mortgage History
| Date | Status | Loan Amount | Loan Type |
|---|---|---|---|
| Open | $30,000 | Stand Alone Refi Refinance Of Original Loan | |
| Open | $125,681 | New Conventional |
Source: State-Wide MLS
MLS Number: 1398958
APN: CRAN-000005-000003-001043
Disclaimer: Certain information contained herein is derived from information provided by parties other than Homes.com. All information provided is deemed reliable, but is not guaranteed to be accurate and should be independently verified.
![]() IDX information is provided exclusively for personal, non-commercial use, and may not be used for any purpose other than to identify prospective properties consumers may be interested in purchasing. Information is deemed reliable but not guaranteed.
IDX information is provided exclusively for personal, non-commercial use, and may not be used for any purpose other than to identify prospective properties consumers may be interested in purchasing. Information is deemed reliable but not guaranteed.
Copyright © 2025 State-Wide MLS, Inc. All rights reserved.
- 15 Spruce Ave
- 150 Riverside Ave
- 167 Forest Ave
- 10 Woburn St
- 105 Broadmoor Rd
- 120 Gould Ave
- 35 Manson Ave
- 110 Heath Ave
- 20 Koster St
- 105 Fordson Ave
- 113 Fordson Ave
- 132 Fordson Ave Unit 12
- 35 Welfare Ave
- 85 Alton St
- 483 Pontiac Ave
- 65 Perkins Ave
- 124 Clarence St
- 70 Perkins Ave
- 36 Blackamore Ave
- 27 Frederick St
