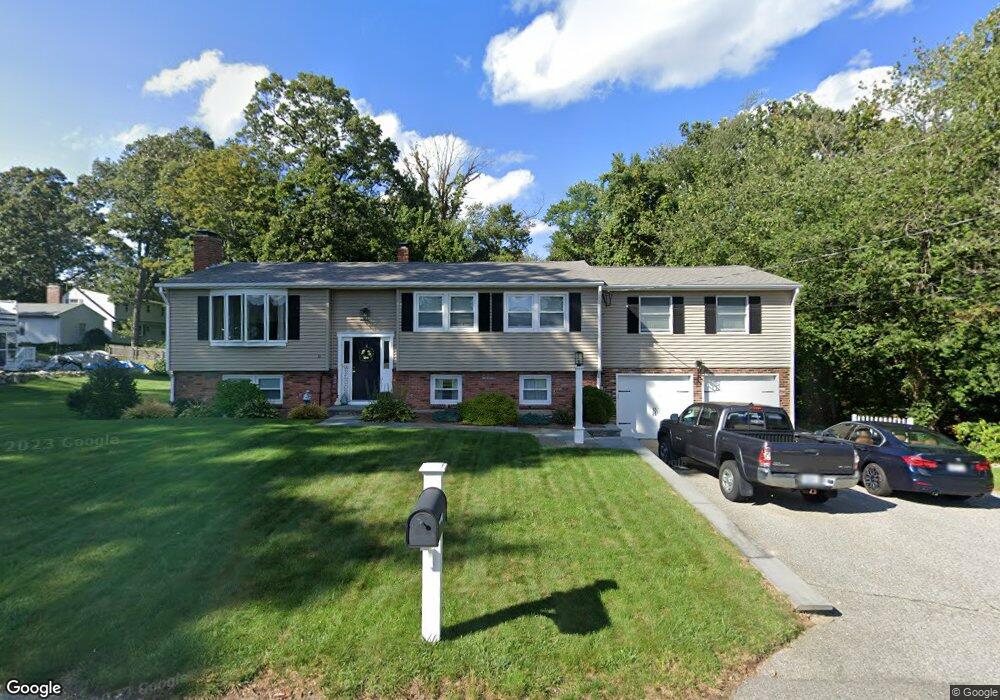
81 Amherst St Cumberland, RI 02864
Valley Falls NeighborhoodEstimated Value: $508,000 - $626,000
4
Beds
3
Baths
2,078
Sq Ft
$271/Sq Ft
Est. Value
About This Home
This home is located at 81 Amherst St, Cumberland, RI 02864 and is currently estimated at $564,169, approximately $271 per square foot. 81 Amherst St is a home located in Providence County with nearby schools including B.F. Norton Elementary School, Joseph L. McCourt Middle School, and Cumberland High School.
Ownership History
Date
Name
Owned For
Owner Type
Purchase Details
Closed on
Jun 30, 1999
Sold by
Nunez Nicolas R and Nunez Wendy K
Bought by
Small Robert F and Kelly Julie A
Current Estimated Value
Purchase Details
Closed on
Aug 31, 1990
Sold by
Laliberte Christine F
Bought by
Nunez Nicolas R
Create a Home Valuation Report for This Property
The Home Valuation Report is an in-depth analysis detailing your home's value as well as a comparison with similar homes in the area
Home Values in the Area
Average Home Value in this Area
Purchase History
| Date | Buyer | Sale Price | Title Company |
|---|---|---|---|
| Small Robert F | $178,000 | -- | |
| Nunez Nicolas R | $127,000 | -- |
Source: Public Records
Mortgage History
| Date | Status | Borrower | Loan Amount |
|---|---|---|---|
| Open | Nunez Nicolas R | $50,000 | |
| Open | Nunez Nicolas R | $165,600 | |
| Closed | Nunez Nicolas R | $15,000 | |
| Closed | Nunez Nicolas R | $179,000 |
Source: Public Records
Tax History Compared to Growth
Tax History
| Year | Tax Paid | Tax Assessment Tax Assessment Total Assessment is a certain percentage of the fair market value that is determined by local assessors to be the total taxable value of land and additions on the property. | Land | Improvement |
|---|---|---|---|---|
| 2025 | $5,782 | $471,200 | $144,900 | $326,300 |
| 2024 | $5,631 | $471,200 | $144,900 | $326,300 |
| 2023 | $5,475 | $471,200 | $144,900 | $326,300 |
| 2022 | $5,362 | $357,700 | $101,300 | $256,400 |
| 2021 | $5,272 | $357,700 | $101,300 | $256,400 |
| 2020 | $5,122 | $357,700 | $101,300 | $256,400 |
| 2019 | $4,959 | $312,300 | $84,600 | $227,700 |
| 2018 | $4,816 | $312,300 | $84,600 | $227,700 |
| 2017 | $4,750 | $312,300 | $84,600 | $227,700 |
| 2016 | $3,959 | $231,800 | $77,000 | $154,800 |
| 2015 | $3,959 | $231,800 | $77,000 | $154,800 |
| 2014 | $3,611 | $231,800 | $77,000 | $154,800 |
| 2013 | $3,989 | $252,800 | $77,300 | $175,500 |
Source: Public Records
Map
Nearby Homes