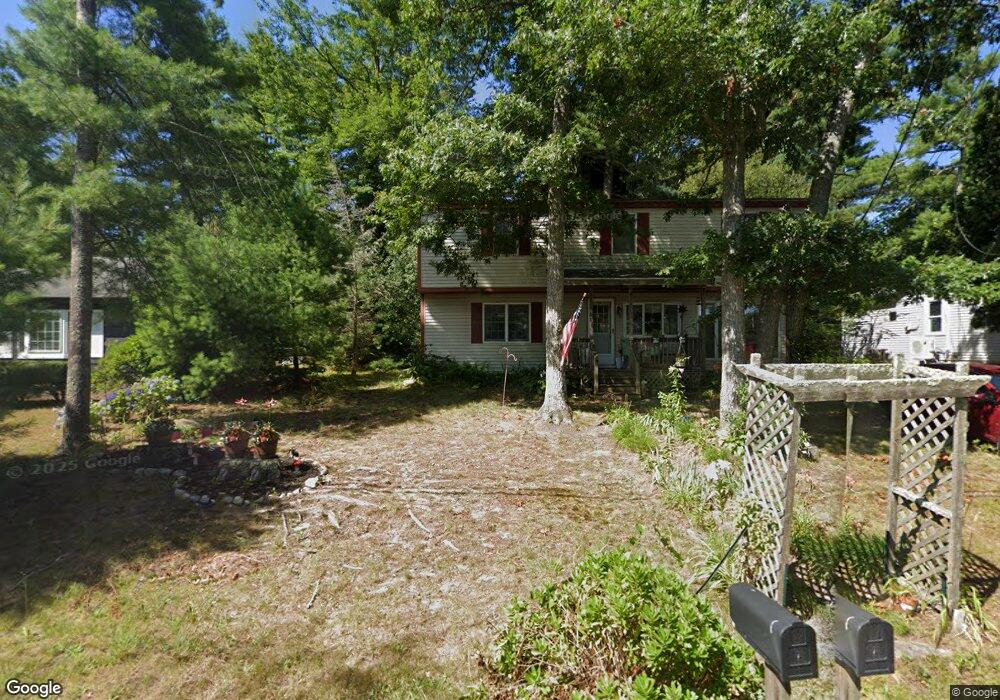
81 Blackmore Pond Rd West Wareham, MA 02576
Estimated Value: $449,767 - $521,000
3
Beds
2
Baths
1,368
Sq Ft
$351/Sq Ft
Est. Value
About This Home
This home is located at 81 Blackmore Pond Rd, West Wareham, MA 02576 and is currently estimated at $479,942, approximately $350 per square foot. 81 Blackmore Pond Rd is a home located in Plymouth County.
Ownership History
Date
Name
Owned For
Owner Type
Purchase Details
Closed on
Jul 24, 2002
Sold by
Alves Frank S and Alves Donna M
Bought by
Barry C Cosgrove T and Cosgrove Barry T
Current Estimated Value
Purchase Details
Closed on
Jul 20, 1990
Sold by
Lundell Howard N
Bought by
Alves Frank S
Home Financials for this Owner
Home Financials are based on the most recent Mortgage that was taken out on this home.
Original Mortgage
$50,000
Interest Rate
9.94%
Mortgage Type
Purchase Money Mortgage
Create a Home Valuation Report for This Property
The Home Valuation Report is an in-depth analysis detailing your home's value as well as a comparison with similar homes in the area
Home Values in the Area
Average Home Value in this Area
Purchase History
| Date | Buyer | Sale Price | Title Company |
|---|---|---|---|
| Barry C Cosgrove T | $208,000 | -- | |
| Barry C Cosgrove T C | $208,000 | -- | |
| Alves Frank S | $82,000 | -- | |
| Alves Frank S | $82,000 | -- |
Source: Public Records
Mortgage History
| Date | Status | Borrower | Loan Amount |
|---|---|---|---|
| Previous Owner | Alves Frank S | $50,000 |
Source: Public Records
Tax History Compared to Growth
Tax History
| Year | Tax Paid | Tax Assessment Tax Assessment Total Assessment is a certain percentage of the fair market value that is determined by local assessors to be the total taxable value of land and additions on the property. | Land | Improvement |
|---|---|---|---|---|
| 2025 | $3,707 | $355,800 | $123,800 | $232,000 |
| 2024 | $3,580 | $318,800 | $95,800 | $223,000 |
| 2023 | $3,225 | $283,500 | $87,200 | $196,300 |
| 2022 | $3,225 | $244,700 | $87,200 | $157,500 |
| 2021 | $3,184 | $236,700 | $87,200 | $149,500 |
| 2020 | $2,998 | $226,100 | $87,200 | $138,900 |
| 2019 | $2,762 | $207,800 | $81,300 | $126,500 |
| 2018 | $2,659 | $195,100 | $81,300 | $113,800 |
| 2017 | $2,522 | $187,500 | $81,300 | $106,200 |
| 2016 | $2,284 | $168,800 | $77,800 | $91,000 |
| 2015 | $2,206 | $168,800 | $77,800 | $91,000 |
| 2014 | $2,539 | $197,600 | $77,800 | $119,800 |
Source: Public Records
Map
Nearby Homes
- 79 Blackmore Pond Rd
- 83 Blackmore Pond Rd
- 85 Blackmore Pond Rd
- 77 Blackmore Pond Rd
- 1 Blackmore Pond Rd
- 87 Blackmore Pond Rd
- 66 Blackmore Pond Rd
- 89 Blackmore Pond Rd
- 64 Blackmore Pond Rd
- 82 Blackmore Pond Rd
- Lot 1003-C Blackmore Pond Rd
- 0 Farrell Ct
- 1 Farrell Ct
- 5 Farrell Ct
- 7 Farrell Ct
- 7 Farrell Ct
- 6 Farrell Ct
- 9 Farrell Ct
- 11 Farrell Ct
- 52 Blackmore Pond Rd