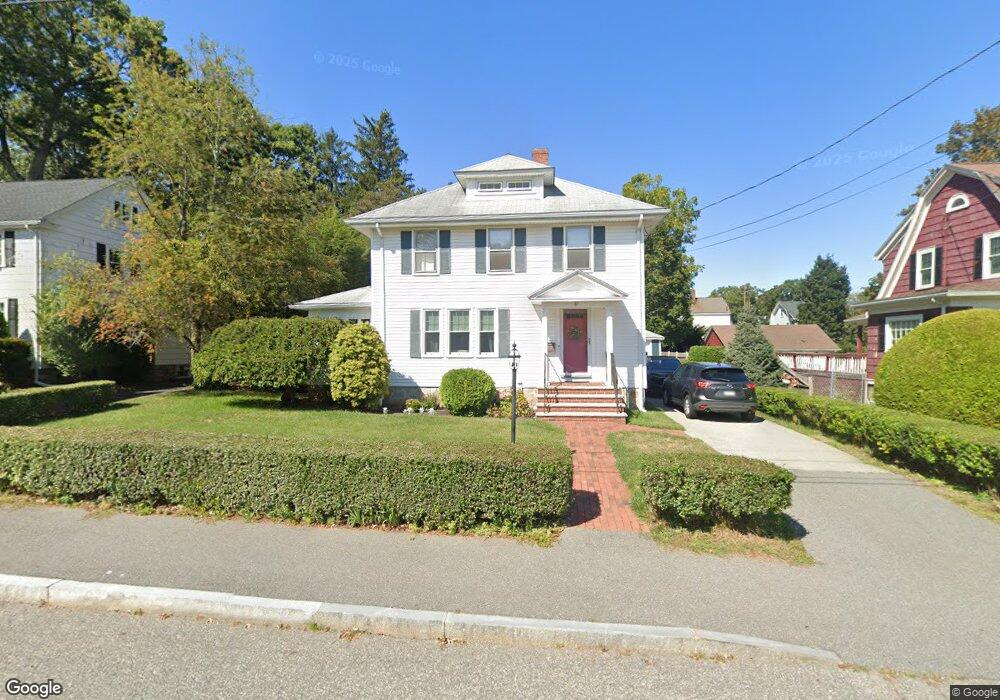
81 Brow Ave Braintree, MA 02184
North Braintree NeighborhoodEstimated Value: $926,000 - $1,095,000
4
Beds
2
Baths
2,488
Sq Ft
$391/Sq Ft
Est. Value
About This Home
This home is located at 81 Brow Ave, Braintree, MA 02184 and is currently estimated at $972,694, approximately $390 per square foot. 81 Brow Ave is a home located in Norfolk County with nearby schools including Braintree High School, Meeting House Montessori School, and Thayer Academy.
Ownership History
Date
Name
Owned For
Owner Type
Purchase Details
Closed on
Jul 16, 2020
Sold by
Turley James D
Bought by
Turley James D and Turley Jennifer D
Current Estimated Value
Purchase Details
Closed on
Dec 13, 2006
Sold by
Turley James D and Turley Paula A
Bought by
Turley James D
Purchase Details
Closed on
Nov 18, 1993
Sold by
Shipp George W and Shipp Janet R
Bought by
Turley James D
Home Financials for this Owner
Home Financials are based on the most recent Mortgage that was taken out on this home.
Original Mortgage
$115,000
Interest Rate
6.77%
Mortgage Type
Purchase Money Mortgage
Create a Home Valuation Report for This Property
The Home Valuation Report is an in-depth analysis detailing your home's value as well as a comparison with similar homes in the area
Home Values in the Area
Average Home Value in this Area
Purchase History
| Date | Buyer | Sale Price | Title Company |
|---|---|---|---|
| Turley James D | -- | None Available | |
| Turley James D | -- | -- | |
| Turley James D | $183,000 | -- | |
| Turley James D | $183,000 | -- |
Source: Public Records
Mortgage History
| Date | Status | Borrower | Loan Amount |
|---|---|---|---|
| Previous Owner | Turley James D | $80,000 | |
| Previous Owner | Turley James D | $115,000 | |
| Previous Owner | Turley James D | $35,000 |
Source: Public Records
Tax History Compared to Growth
Tax History
| Year | Tax Paid | Tax Assessment Tax Assessment Total Assessment is a certain percentage of the fair market value that is determined by local assessors to be the total taxable value of land and additions on the property. | Land | Improvement |
|---|---|---|---|---|
| 2025 | $8,057 | $807,300 | $379,800 | $427,500 |
| 2024 | $7,265 | $766,400 | $356,000 | $410,400 |
| 2023 | $6,934 | $710,400 | $322,800 | $387,600 |
| 2022 | $6,690 | $672,400 | $284,800 | $387,600 |
| 2021 | $6,464 | $649,600 | $284,800 | $364,800 |
| 2020 | $6,068 | $615,400 | $250,600 | $364,800 |
| 2019 | $5,819 | $576,700 | $250,600 | $326,100 |
| 2018 | $5,534 | $525,000 | $208,900 | $316,100 |
| 2017 | $5,491 | $511,300 | $208,900 | $302,400 |
| 2016 | $5,206 | $474,100 | $189,900 | $284,200 |
| 2015 | $5,090 | $459,800 | $187,000 | $272,800 |
| 2014 | $4,822 | $422,200 | $169,900 | $252,300 |
Source: Public Records
Map
Nearby Homes
- 29 Norton St
- 175 West St
- 37 Monatiquot Ave
- 305 Franklin St
- 491 Washington St Unit 1
- 10 Cochato Rd
- 17 Judson St
- 65 Tremont St
- 78 Windemere Cir
- 14-20 Randall Ave
- 6 Franklin St
- 53 Parkside Ave
- 63 Dickerman Ln
- 8 Vinton Ave Unit 10
- 145 Hancock St Unit 214
- 7 Carter Rd
- 47 Addison St
- 414 John Mahar Hwy Unit 312
- 418 John Mahar Hwy Unit 408
- 57 Graziano Dr