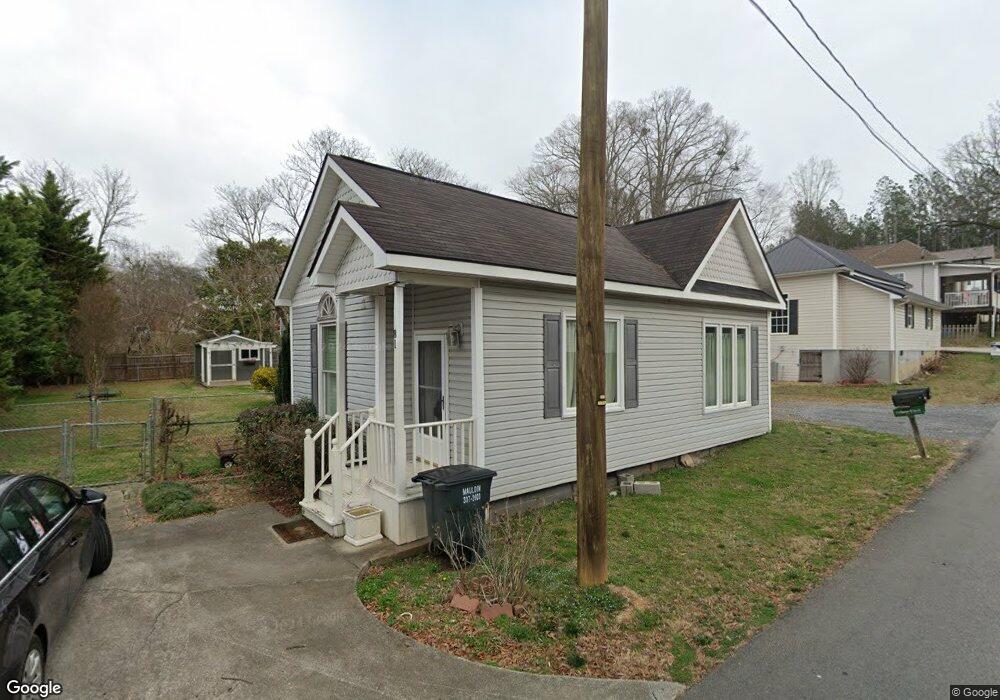
81 Echota 2nd St Calhoun, GA 30701
Estimated Value: $161,000 - $212,000
1
Bed
2
Baths
1,153
Sq Ft
$159/Sq Ft
Est. Value
About This Home
This home is located at 81 Echota 2nd St, Calhoun, GA 30701 and is currently estimated at $183,560, approximately $159 per square foot. 81 Echota 2nd St is a home located in Gordon County with nearby schools including Calhoun Primary School, Calhoun Elementary School, and Calhoun Middle School.
Ownership History
Date
Name
Owned For
Owner Type
Purchase Details
Closed on
Nov 28, 2011
Sold by
Wetton Neva Faith
Bought by
Argabright Judith E
Current Estimated Value
Home Financials for this Owner
Home Financials are based on the most recent Mortgage that was taken out on this home.
Original Mortgage
$68,225
Outstanding Balance
$46,084
Interest Rate
3.75%
Mortgage Type
FHA
Estimated Equity
$137,476
Purchase Details
Closed on
Feb 21, 2011
Sold by
Wetton Neva Faith
Bought by
Wetton Neva Faith and Wetton Jayne Elizabeth
Purchase Details
Closed on
Mar 25, 2008
Sold by
Duke Gary
Bought by
Wetton Neva
Purchase Details
Closed on
Jun 5, 2007
Sold by
Layson Linda J
Bought by
Duke Gary and Duke Heath
Purchase Details
Closed on
Oct 20, 2004
Sold by
Layson Lynda H
Bought by
Layson Lynda J
Purchase Details
Closed on
Feb 27, 1998
Bought by
Layson Lynda H
Create a Home Valuation Report for This Property
The Home Valuation Report is an in-depth analysis detailing your home's value as well as a comparison with similar homes in the area
Home Values in the Area
Average Home Value in this Area
Purchase History
| Date | Buyer | Sale Price | Title Company |
|---|---|---|---|
| Argabright Judith E | $70,000 | -- | |
| Wetton Neva Faith | -- | -- | |
| Wetton Neva | $73,000 | -- | |
| Duke Gary | $56,847 | -- | |
| Layson Lynda J | $86,000 | -- | |
| Layson Lynda H | $25,000 | -- |
Source: Public Records
Mortgage History
| Date | Status | Borrower | Loan Amount |
|---|---|---|---|
| Open | Argabright Judith E | $68,225 |
Source: Public Records
Tax History Compared to Growth
Tax History
| Year | Tax Paid | Tax Assessment Tax Assessment Total Assessment is a certain percentage of the fair market value that is determined by local assessors to be the total taxable value of land and additions on the property. | Land | Improvement |
|---|---|---|---|---|
| 2024 | $1,178 | $42,560 | $2,760 | $39,800 |
| 2023 | $1,101 | $39,800 | $2,760 | $37,040 |
| 2022 | $309 | $32,480 | $2,520 | $29,960 |
| 2021 | $792 | $26,600 | $2,040 | $24,560 |
| 2020 | $809 | $26,960 | $2,040 | $24,920 |
| 2019 | $808 | $26,960 | $2,040 | $24,920 |
| 2018 | $241 | $25,000 | $2,040 | $22,960 |
| 2017 | $232 | $23,560 | $2,040 | $21,520 |
| 2016 | $232 | $23,560 | $2,040 | $21,520 |
| 2015 | $230 | $23,080 | $2,040 | $21,040 |
| 2014 | $215 | $21,881 | $2,058 | $19,823 |
Source: Public Records
Map
Nearby Homes
- 113 Waterside Dr
- 91 Echota 4th St
- 98 Echota 5th St
- 125 Mill Pond Ln
- 113 Mill Pond Ln
- 108 Mill Stone Dr
- 106 Millers Ln
- 106 Windmill Ct
- 104 Windmill Ct
- 115 Old Mill Dr
- 122 Millers Ln
- 135 Millers Ln
- 137 Millers Ln
- 622 Pisgah Way
- 103 Mims Dr
- 154 Millers Ln
- 118 Old Mill Dr
- 145 Green Row
- 0 Red Bud Rd NE Unit 123029
- 106 Mount Vernon Dr
- 0 Tract 2 Kensington Dr Unit 4316117
- 0 Tract 2 Kensington Dr
- 80 Echota 2nd St
- 0 2nd
- 72 2nd
- 79 Echota 2nd St
- 82 Echota 3rd St
- 72 Echota 2nd St
- 2nd Street
- 83 Echota 3rd St
- 83 3rd St
- 73 Echota 2nd St
- 75 2nd
- 74 2nd
- 3rd Echota 3rd St
- 78 Echota 2nd St
- 75 Echota 2nd St
- 75 Echota 2nd St Unit ECHOTA
- 84 Echota 3rd St
- 74 Echota 2nd St