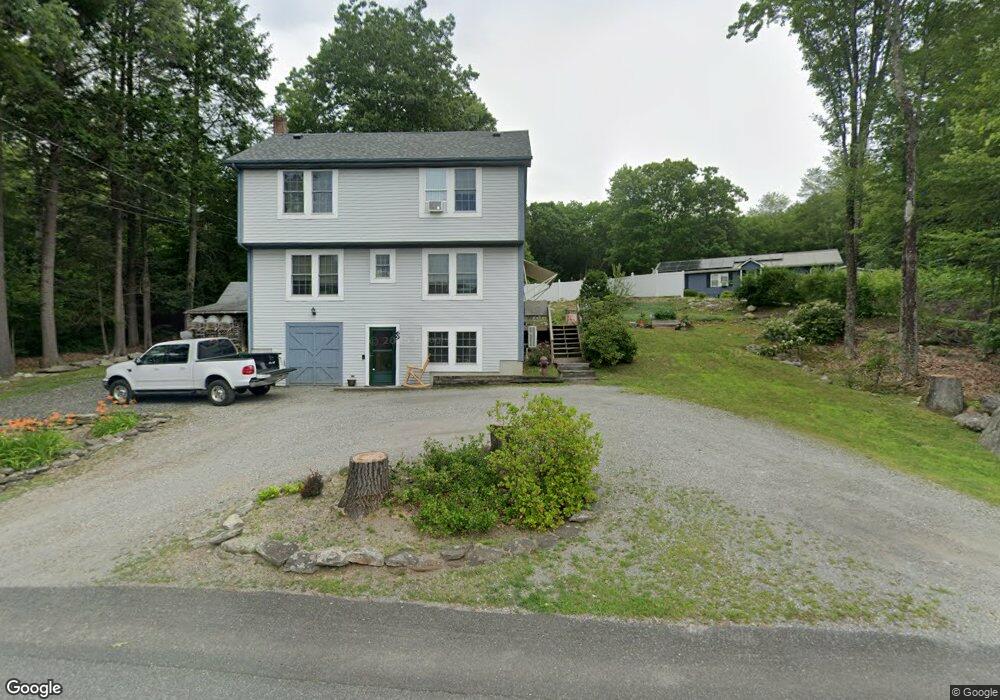
81 High St Erving, MA 01344
Estimated Value: $422,573 - $509,000
3
Beds
3
Baths
2,060
Sq Ft
$225/Sq Ft
Est. Value
About This Home
This home is located at 81 High St, Erving, MA 01344 and is currently estimated at $462,643, approximately $224 per square foot. 81 High St is a home located in Franklin County with nearby schools including Erving Elementary School and Kemsley Academy.
Ownership History
Date
Name
Owned For
Owner Type
Purchase Details
Closed on
Aug 3, 2016
Sold by
Sicard Terrance J
Bought by
Lively Durand D and Lively Jennifer L
Current Estimated Value
Home Financials for this Owner
Home Financials are based on the most recent Mortgage that was taken out on this home.
Original Mortgage
$256,500
Outstanding Balance
$204,079
Interest Rate
3.56%
Mortgage Type
New Conventional
Estimated Equity
$258,564
Create a Home Valuation Report for This Property
The Home Valuation Report is an in-depth analysis detailing your home's value as well as a comparison with similar homes in the area
Home Values in the Area
Average Home Value in this Area
Purchase History
| Date | Buyer | Sale Price | Title Company |
|---|---|---|---|
| Lively Durand D | $270,000 | -- | |
| Lively Durand D | $270,000 | -- |
Source: Public Records
Mortgage History
| Date | Status | Borrower | Loan Amount |
|---|---|---|---|
| Open | Lively Durand D | $256,500 | |
| Closed | Lively Durand D | $256,500 |
Source: Public Records
Tax History
| Year | Tax Paid | Tax Assessment Tax Assessment Total Assessment is a certain percentage of the fair market value that is determined by local assessors to be the total taxable value of land and additions on the property. | Land | Improvement |
|---|---|---|---|---|
| 2025 | $5,611 | $368,900 | $70,100 | $298,800 |
| 2024 | $5,211 | $331,900 | $70,100 | $261,800 |
| 2023 | $5,599 | $309,500 | $70,100 | $239,400 |
| 2022 | $4,733 | $282,400 | $70,100 | $212,300 |
| 2021 | $5,442 | $272,400 | $59,600 | $212,800 |
| 2020 | $4,306 | $245,100 | $59,600 | $185,500 |
| 2019 | $4,072 | $237,700 | $63,100 | $174,600 |
| 2018 | $3,796 | $222,100 | $63,100 | $159,000 |
| 2017 | $3,702 | $222,100 | $63,100 | $159,000 |
| 2016 | $3,920 | $222,600 | $60,300 | $162,300 |
| 2015 | $3,775 | $222,600 | $60,300 | $162,300 |
| 2014 | $3,637 | $222,600 | $60,300 | $162,300 |
Source: Public Records
Map
Nearby Homes
- 0 State Rd Lot 0
- 10 E Prospect St
- 10 W Main St
- 62 E Main St
- 0 Old Farley Rd
- 44 Moss Brook Rd
- 13 Maple Ave
- 0 State Rd
- 270 Wendell Depot Rd
- 351 Farley Rd
- 0 Wendell Depot Rd
- 0 Four Mile Brook Rd Unit 73462497
- 30 Stone Valley Rd
- 216 Holtshire Rd
- 222 W River St
- 56 Shelter St
- 166-168 W Main St
- 28 Morse Village Rd
- 30 Cottage St
- 246 Holtshire Rd Unit Lot 3
Your Personal Tour Guide
Ask me questions while you tour the home.