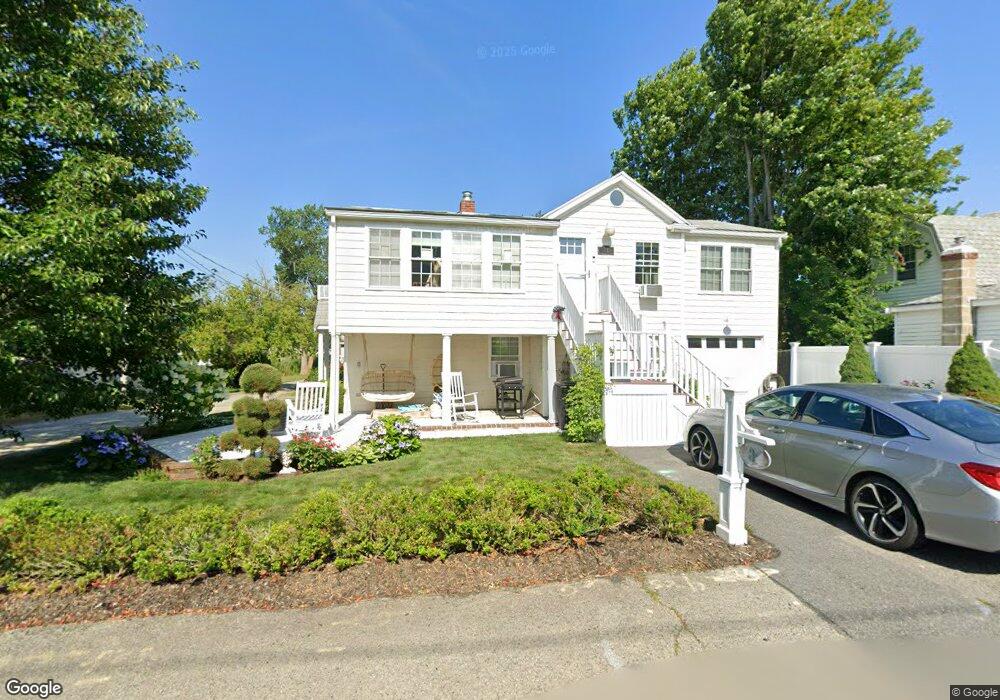
81 Island St Brant Rock, MA 02020
Ocean Bluff-Brant Rock NeighborhoodEstimated Value: $742,159 - $860,000
5
Beds
2
Baths
1,911
Sq Ft
$419/Sq Ft
Est. Value
About This Home
This home is located at 81 Island St, Brant Rock, MA 02020 and is currently estimated at $801,080, approximately $419 per square foot. 81 Island St is a home with nearby schools including Governor Edward Winslow School, Furnace Brook Middle School, and Marshfield High School.
Ownership History
Date
Name
Owned For
Owner Type
Purchase Details
Closed on
Mar 28, 2022
Sold by
Brillant Gregory P
Bought by
Gregory P Brillant Lt and Brillant
Current Estimated Value
Purchase Details
Closed on
Apr 12, 2000
Sold by
Brillant Reginald
Bought by
Brillant Gregory P
Create a Home Valuation Report for This Property
The Home Valuation Report is an in-depth analysis detailing your home's value as well as a comparison with similar homes in the area
Home Values in the Area
Average Home Value in this Area
Purchase History
| Date | Buyer | Sale Price | Title Company |
|---|---|---|---|
| Gregory P Brillant Lt | -- | None Available | |
| Gregory P Brillant Lt | -- | None Available | |
| Brillant Gregory P | $25,000 | -- | |
| Brillant Gregory P | $25,000 | -- |
Source: Public Records
Tax History Compared to Growth
Tax History
| Year | Tax Paid | Tax Assessment Tax Assessment Total Assessment is a certain percentage of the fair market value that is determined by local assessors to be the total taxable value of land and additions on the property. | Land | Improvement |
|---|---|---|---|---|
| 2025 | $6,289 | $635,300 | $317,100 | $318,200 |
| 2024 | $6,053 | $582,600 | $297,300 | $285,300 |
| 2023 | $5,246 | $512,600 | $267,600 | $245,000 |
| 2022 | $5,246 | $405,100 | $227,900 | $177,200 |
| 2021 | $5,066 | $384,100 | $218,000 | $166,100 |
| 2020 | $4,724 | $354,400 | $188,300 | $166,100 |
| 2019 | $4,742 | $354,400 | $188,300 | $166,100 |
| 2018 | $4,674 | $349,600 | $188,300 | $161,300 |
| 2017 | $4,274 | $311,500 | $178,400 | $133,100 |
| 2016 | $4,186 | $301,600 | $168,500 | $133,100 |
| 2015 | $4,008 | $301,600 | $168,500 | $133,100 |
| 2014 | $4,008 | $301,600 | $168,500 | $133,100 |
Source: Public Records
Map
Nearby Homes