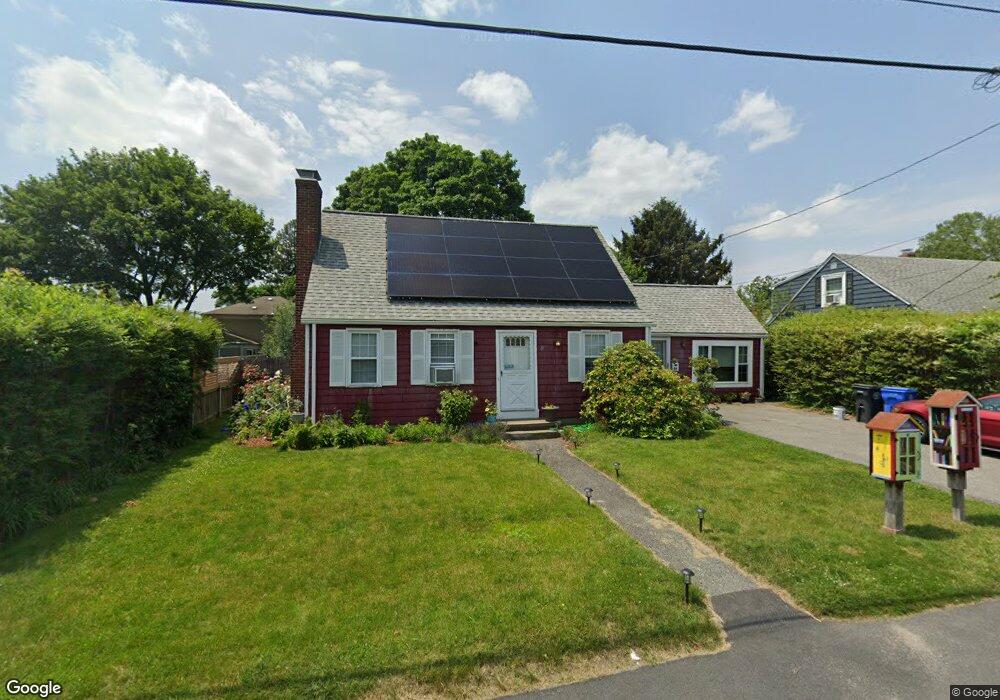
81 Kenyon Rd Cranston, RI 02910
Eden Park NeighborhoodEstimated Value: $483,000 - $505,000
3
Beds
2
Baths
3,110
Sq Ft
$159/Sq Ft
Est. Value
About This Home
This home is located at 81 Kenyon Rd, Cranston, RI 02910 and is currently estimated at $494,533, approximately $159 per square foot. 81 Kenyon Rd is a home located in Providence County with nearby schools including Park View Middle School, Cranston High School East, and Cadence Academy Preschool - Cranston.
Ownership History
Date
Name
Owned For
Owner Type
Purchase Details
Closed on
May 17, 2018
Sold by
Pasonelli Joseph J and Pasonelli Virginia H
Bought by
Leaheey Lisa D
Current Estimated Value
Home Financials for this Owner
Home Financials are based on the most recent Mortgage that was taken out on this home.
Original Mortgage
$207,500
Outstanding Balance
$177,120
Interest Rate
4.4%
Mortgage Type
Purchase Money Mortgage
Estimated Equity
$317,413
Create a Home Valuation Report for This Property
The Home Valuation Report is an in-depth analysis detailing your home's value as well as a comparison with similar homes in the area
Home Values in the Area
Average Home Value in this Area
Purchase History
| Date | Buyer | Sale Price | Title Company |
|---|---|---|---|
| Leaheey Lisa D | $245,000 | -- |
Source: Public Records
Mortgage History
| Date | Status | Borrower | Loan Amount |
|---|---|---|---|
| Open | Leaheey Lisa D | $207,500 | |
| Previous Owner | Leaheey Lisa D | $100,000 | |
| Previous Owner | Leaheey Lisa D | $96,836 |
Source: Public Records
Tax History
| Year | Tax Paid | Tax Assessment Tax Assessment Total Assessment is a certain percentage of the fair market value that is determined by local assessors to be the total taxable value of land and additions on the property. | Land | Improvement |
|---|---|---|---|---|
| 2025 | $5,491 | $395,600 | $109,400 | $286,200 |
| 2024 | $5,175 | $380,200 | $109,400 | $270,800 |
| 2023 | $5,290 | $279,900 | $72,000 | $207,900 |
| 2022 | $5,181 | $279,900 | $72,000 | $207,900 |
| 2021 | $5,038 | $279,900 | $72,000 | $207,900 |
| 2020 | $4,530 | $218,100 | $68,600 | $149,500 |
| 2019 | $4,530 | $218,100 | $68,600 | $149,500 |
| 2018 | $4,425 | $218,100 | $68,600 | $149,500 |
| 2017 | $4,189 | $182,600 | $61,800 | $120,800 |
| 2016 | $4,099 | $182,600 | $61,800 | $120,800 |
| 2015 | $4,099 | $182,600 | $61,800 | $120,800 |
| 2014 | $4,013 | $175,700 | $61,800 | $113,900 |
Source: Public Records
Map
Nearby Homes
Your Personal Tour Guide
Ask me questions while you tour the home.