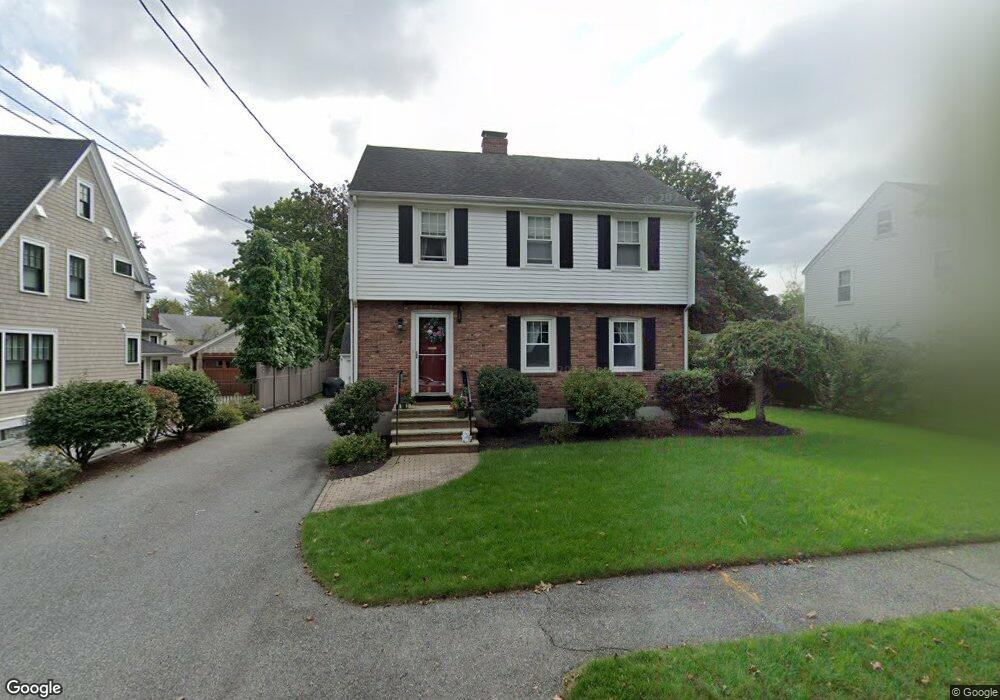
81 Lorimer Rd Belmont, MA 02478
Belmont Hill NeighborhoodEstimated Value: $1,062,000 - $1,457,000
3
Beds
2
Baths
1,866
Sq Ft
$715/Sq Ft
Est. Value
About This Home
This home is located at 81 Lorimer Rd, Belmont, MA 02478 and is currently estimated at $1,334,397, approximately $715 per square foot. 81 Lorimer Rd is a home located in Middlesex County with nearby schools including Roger Wellington Elementary School, Winthrop L Chenery Middle School, and Belmont High School.
Ownership History
Date
Name
Owned For
Owner Type
Purchase Details
Closed on
Jul 29, 2011
Sold by
White Joseph
Bought by
Lally Sean
Current Estimated Value
Home Financials for this Owner
Home Financials are based on the most recent Mortgage that was taken out on this home.
Original Mortgage
$417,000
Outstanding Balance
$288,052
Interest Rate
4.52%
Mortgage Type
Purchase Money Mortgage
Estimated Equity
$1,046,345
Purchase Details
Closed on
Dec 13, 2005
Sold by
Bolea Alessandro M Est
Bought by
White Joseph
Home Financials for this Owner
Home Financials are based on the most recent Mortgage that was taken out on this home.
Original Mortgage
$406,000
Interest Rate
6.17%
Mortgage Type
Purchase Money Mortgage
Purchase Details
Closed on
Aug 10, 1998
Sold by
Kyle William G and Kyle Ann F
Bought by
Bolea Alessandro M
Create a Home Valuation Report for This Property
The Home Valuation Report is an in-depth analysis detailing your home's value as well as a comparison with similar homes in the area
Home Values in the Area
Average Home Value in this Area
Purchase History
| Date | Buyer | Sale Price | Title Company |
|---|---|---|---|
| Lally Sean | $655,000 | -- | |
| White Joseph | $580,000 | -- | |
| Bolea Alessandro M | $338,000 | -- |
Source: Public Records
Mortgage History
| Date | Status | Borrower | Loan Amount |
|---|---|---|---|
| Open | Lally Sean | $417,000 | |
| Closed | Bolea Alessandro M | $38,000 | |
| Previous Owner | Bolea Alessandro M | $350,000 | |
| Previous Owner | White Joseph | $406,000 |
Source: Public Records
Tax History Compared to Growth
Tax History
| Year | Tax Paid | Tax Assessment Tax Assessment Total Assessment is a certain percentage of the fair market value that is determined by local assessors to be the total taxable value of land and additions on the property. | Land | Improvement |
|---|---|---|---|---|
| 2025 | $15,377 | $1,350,000 | $726,000 | $624,000 |
| 2024 | $13,538 | $1,282,000 | $779,000 | $503,000 |
| 2023 | $13,409 | $1,193,000 | $735,000 | $458,000 |
| 2022 | $12,704 | $1,099,000 | $673,000 | $426,000 |
| 2021 | $11,419 | $1,050,000 | $645,000 | $405,000 |
| 2020 | $11,990 | $1,090,000 | $682,000 | $408,000 |
| 2019 | $10,386 | $890,000 | $528,000 | $362,000 |
| 2018 | $9,501 | $782,000 | $430,000 | $352,000 |
| 2017 | $7,995 | $630,000 | $348,000 | $282,000 |
| 2016 | $7,888 | $628,000 | $348,000 | $280,000 |
| 2015 | $7,495 | $581,000 | $289,000 | $292,000 |
Source: Public Records
Map
Nearby Homes
- 14 Mallard Way
- 9 Stanley Rd
- 38 Van Vechten St
- 51 S Cottage Rd Unit 112
- 5 Meadows Ln Unit 105
- 100 Shirley Rd
- 26 Brookfield Rd
- 34 Woodbine Rd
- 135 Marsh St
- 25 Moraine St Unit 25
- 53 Crestview Rd
- 77 Wellesley Rd
- 560 Concord Ave
- 23 Centre Ave
- 26 Centre Ave
- 160 Waverley St
- 220 Sycamore St
- 70A Thomas St
- 600 Trapelo Rd Unit 1
- 39 Birch Hill Rd