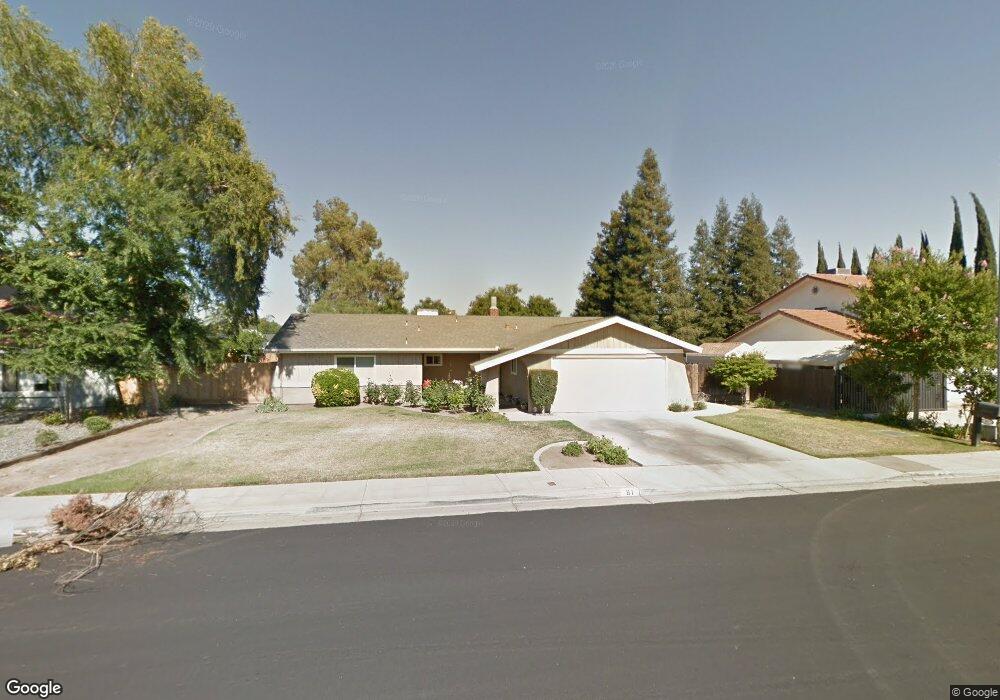
81 N Terry Ave Clovis, CA 93612
Estimated Value: $377,000 - $455,000
3
Beds
2
Baths
1,456
Sq Ft
$286/Sq Ft
Est. Value
About This Home
This home is located at 81 N Terry Ave, Clovis, CA 93612 and is currently estimated at $416,108, approximately $285 per square foot. 81 N Terry Ave is a home located in Fresno County with nearby schools including Cole Elementary School, Alta Sierra Intermediate School, and Buchanan High School.
Ownership History
Date
Name
Owned For
Owner Type
Purchase Details
Closed on
Mar 23, 2024
Sold by
Cunha Sharon K
Bought by
Sharon K Cunha Revocable Trust and Cunha
Current Estimated Value
Purchase Details
Closed on
Mar 19, 2024
Sold by
Cunha Sharon K
Bought by
Sharon K Cunha Revocable Trust and Cunha
Purchase Details
Closed on
Jan 23, 1998
Sold by
Cunha Sharon K
Bought by
Cunha Sharon K
Home Financials for this Owner
Home Financials are based on the most recent Mortgage that was taken out on this home.
Original Mortgage
$103,016
Interest Rate
7.05%
Mortgage Type
FHA
Purchase Details
Closed on
Aug 28, 1996
Sold by
Cunha David V
Bought by
Cunha Sharon K
Home Financials for this Owner
Home Financials are based on the most recent Mortgage that was taken out on this home.
Original Mortgage
$101,227
Interest Rate
8.23%
Mortgage Type
FHA
Purchase Details
Closed on
Aug 6, 1996
Sold by
Pamela Beck
Bought by
Cunha Sharon K
Home Financials for this Owner
Home Financials are based on the most recent Mortgage that was taken out on this home.
Original Mortgage
$101,227
Interest Rate
8.23%
Mortgage Type
FHA
Create a Home Valuation Report for This Property
The Home Valuation Report is an in-depth analysis detailing your home's value as well as a comparison with similar homes in the area
Home Values in the Area
Average Home Value in this Area
Purchase History
| Date | Buyer | Sale Price | Title Company |
|---|---|---|---|
| Sharon K Cunha Revocable Trust | -- | None Listed On Document | |
| Sharon K Cunha Revocable Trust | -- | None Listed On Document | |
| Cunha Sharon K | -- | North American Title Co | |
| Cunha Sharon K | -- | Central Title Company | |
| Cunha Sharon K | $110,000 | Central Title Company |
Source: Public Records
Mortgage History
| Date | Status | Borrower | Loan Amount |
|---|---|---|---|
| Previous Owner | Cunha Sharon K | $103,016 | |
| Previous Owner | Cunha Sharon K | $101,227 |
Source: Public Records
Tax History
| Year | Tax Paid | Tax Assessment Tax Assessment Total Assessment is a certain percentage of the fair market value that is determined by local assessors to be the total taxable value of land and additions on the property. | Land | Improvement |
|---|---|---|---|---|
| 2025 | $2,116 | $185,273 | $52,100 | $133,173 |
| 2023 | $2,033 | $178,080 | $50,078 | $128,002 |
| 2022 | $2,004 | $174,590 | $49,097 | $125,493 |
| 2021 | $1,947 | $171,168 | $48,135 | $123,033 |
| 2020 | $1,939 | $169,414 | $47,642 | $121,772 |
| 2019 | $1,900 | $166,093 | $46,708 | $119,385 |
| 2018 | $1,857 | $162,838 | $45,793 | $117,045 |
| 2017 | $1,824 | $159,646 | $44,896 | $114,750 |
| 2016 | $1,761 | $156,516 | $44,016 | $112,500 |
| 2015 | $1,733 | $154,166 | $43,355 | $110,811 |
| 2014 | $1,699 | $151,147 | $42,506 | $108,641 |
Source: Public Records
Map
Nearby Homes
- 131 N Terry Ave
- 345 Sylmar Ave
- 288 W Magill Ave
- 351 N Peach Ave
- 742 W Ellery Ave
- 474 W Windsor Ave
- 0 Willow Bluff Unit 638378
- 560 W Stuart Ave
- 445 Quill Ln
- 493 Timmy Ave
- 595 Quill Ln
- 570 Timmy Ave
- 484 W Balsam Ln
- 561 Pierce Dr
- 602 W Mahogany Ln
- 684 W Chennault Ave
- 6706 N Chestnut Ave Unit 118
- 1001 Sylmar Ave Unit 3
- 1001 Sylmar Ave Unit 131
- 1001 Sylmar Ave Unit 99
- 91 N Terry Ave
- 71 N Terry Ave
- 82 N Karen Ave
- 72 N Karen Ave
- 92 N Karen Ave
- 101 N Terry Ave
- 88 N Terry Ave
- 72 N Terry Ave
- 94 N Terry Ave
- 102 N Karen Ave
- 111 N Terry Ave
- 494 W Menlo Ave
- 62 N Terry Ave
- 484 W Menlo Ave
- 98 N Terry Ave
- 454 W Paul Ave
- 474 W Menlo Ave
- 85 N Cindy Ave
- 455 W Menlo Ave
- 100 N Terry Ave
Your Personal Tour Guide
Ask me questions while you tour the home.