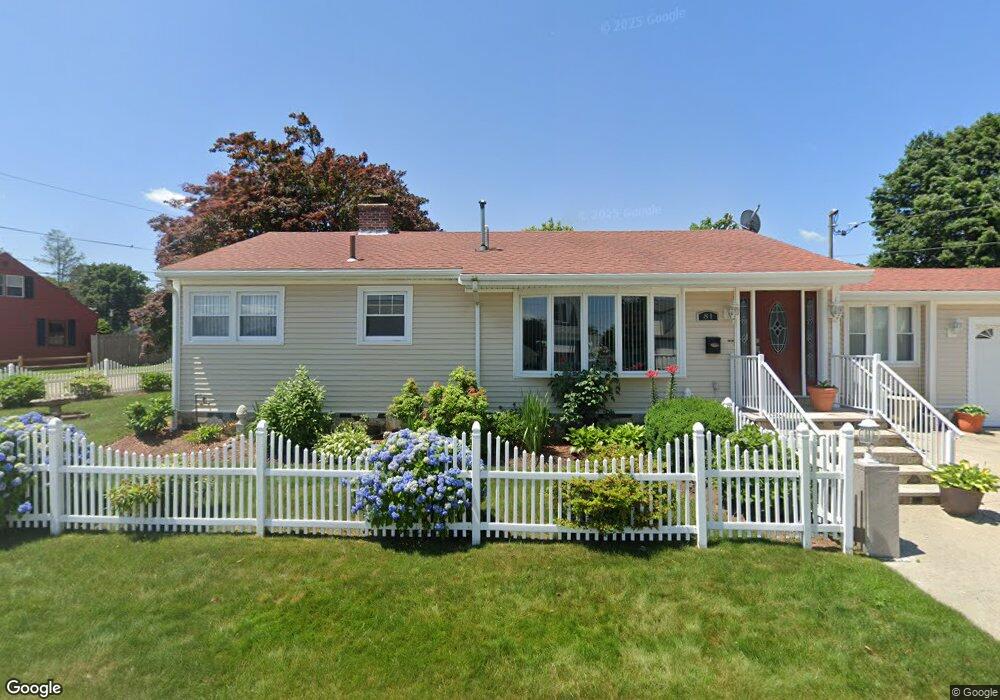
81 Oneida St Pawtucket, RI 02860
Fairlawn NeighborhoodEstimated Value: $392,000 - $436,000
3
Beds
2
Baths
2,080
Sq Ft
$197/Sq Ft
Est. Value
About This Home
This home is located at 81 Oneida St, Pawtucket, RI 02860 and is currently estimated at $409,896, approximately $197 per square foot. 81 Oneida St is a home located in Providence County with nearby schools including Times Squared Academy, The San Miguel School, and Bishop Keough Regional High School.
Ownership History
Date
Name
Owned For
Owner Type
Purchase Details
Closed on
Jan 26, 2011
Sold by
Vieira Carmen H
Bought by
Branco Laurenco S and Branco Filomena M
Current Estimated Value
Home Financials for this Owner
Home Financials are based on the most recent Mortgage that was taken out on this home.
Original Mortgage
$110,000
Outstanding Balance
$74,897
Interest Rate
4.83%
Estimated Equity
$334,999
Purchase Details
Closed on
Oct 15, 1998
Sold by
Lynch Cornelius B
Bought by
Vieira Pedro E and Vieira Carmen
Create a Home Valuation Report for This Property
The Home Valuation Report is an in-depth analysis detailing your home's value as well as a comparison with similar homes in the area
Home Values in the Area
Average Home Value in this Area
Purchase History
| Date | Buyer | Sale Price | Title Company |
|---|---|---|---|
| Branco Laurenco S | $197,000 | -- | |
| Vieira Pedro E | $81,000 | -- |
Source: Public Records
Mortgage History
| Date | Status | Borrower | Loan Amount |
|---|---|---|---|
| Open | Vieira Pedro E | $110,000 | |
| Previous Owner | Vieira Pedro E | $85,000 | |
| Previous Owner | Vieira Pedro E | $97,000 |
Source: Public Records
Tax History Compared to Growth
Tax History
| Year | Tax Paid | Tax Assessment Tax Assessment Total Assessment is a certain percentage of the fair market value that is determined by local assessors to be the total taxable value of land and additions on the property. | Land | Improvement |
|---|---|---|---|---|
| 2025 | $4,334 | $329,600 | $137,400 | $192,200 |
| 2024 | $4,067 | $329,600 | $137,400 | $192,200 |
| 2023 | $4,142 | $244,500 | $70,600 | $173,900 |
| 2022 | $4,054 | $244,500 | $70,600 | $173,900 |
| 2021 | $4,054 | $244,500 | $70,600 | $173,900 |
| 2020 | $4,015 | $192,200 | $67,900 | $124,300 |
| 2019 | $4,015 | $192,200 | $67,900 | $124,300 |
| 2018 | $3,869 | $192,200 | $67,900 | $124,300 |
| 2017 | $3,647 | $160,500 | $53,200 | $107,300 |
| 2016 | $3,513 | $160,500 | $53,200 | $107,300 |
| 2015 | $3,513 | $160,500 | $53,200 | $107,300 |
| 2014 | $3,334 | $144,600 | $59,100 | $85,500 |
Source: Public Records
Map
Nearby Homes