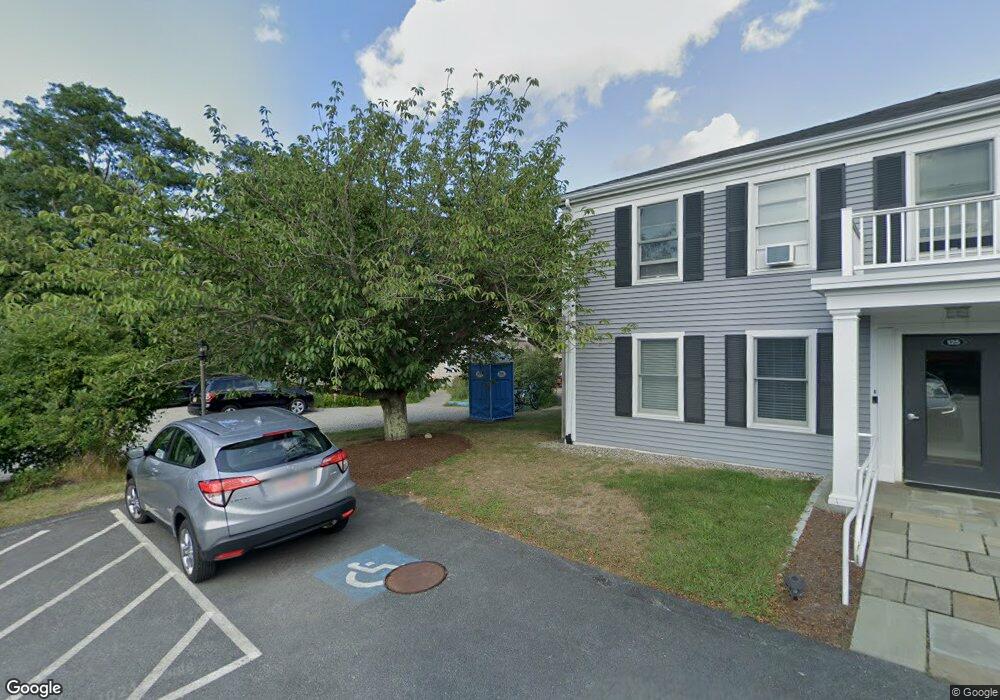
81 Underpass Rd Brewster, MA 02631
Estimated Value: $430,096
Studio
2
Baths
600
Sq Ft
$717/Sq Ft
Est. Value
About This Home
This home is located at 81 Underpass Rd, Brewster, MA 02631 and is currently priced at $430,096, approximately $716 per square foot. 81 Underpass Rd is a home located in Barnstable County with nearby schools including Stony Brook Elementary School, Eddy Elementary School, and Nauset Regional Middle School.
Ownership History
Date
Name
Owned For
Owner Type
Purchase Details
Closed on
Jul 6, 2023
Sold by
Bushwood Mg Llc
Bought by
Putt Around Llc
Current Estimated Value
Home Financials for this Owner
Home Financials are based on the most recent Mortgage that was taken out on this home.
Original Mortgage
$647,000
Outstanding Balance
$629,592
Interest Rate
6.57%
Mortgage Type
Commercial
Purchase Details
Closed on
Apr 17, 2013
Sold by
81 Underpass Nt and Prete
Bought by
Putter A Round Inc
Purchase Details
Closed on
Sep 12, 2008
Sold by
Putter A Round Inc
Bought by
81 Underpass Nt and Prete
Home Financials for this Owner
Home Financials are based on the most recent Mortgage that was taken out on this home.
Original Mortgage
$332,000
Interest Rate
6.58%
Mortgage Type
Commercial
Purchase Details
Closed on
Sep 30, 2002
Sold by
Trainor and Trainor James F
Bought by
Putteraround Inc
Purchase Details
Closed on
Sep 20, 2000
Sold by
81 Underpass Rd Nt and Astrakhan
Bought by
Trainor and Trainor James F
Purchase Details
Closed on
Dec 30, 1994
Sold by
New Bk Of Ne and Fdic
Bought by
Carey Francis L
Create a Home Valuation Report for This Property
The Home Valuation Report is an in-depth analysis detailing your home's value as well as a comparison with similar homes in the area
Home Values in the Area
Average Home Value in this Area
Purchase History
| Date | Buyer | Sale Price | Title Company |
|---|---|---|---|
| Putt Around Llc | $475,000 | None Available | |
| Putter A Round Inc | -- | -- | |
| Putter A Round Inc | -- | -- | |
| 81 Underpass Nt | -- | -- | |
| 81 Underpass Nt | -- | -- | |
| 81 Underpass Nt | -- | -- | |
| Putteraround Inc | $185,000 | -- | |
| Putteraround Inc | $185,000 | -- | |
| Trainor | $120,000 | -- | |
| Trainor | $120,000 | -- | |
| Carey Francis L | $85,000 | -- | |
| Carey Francis L | $85,000 | -- |
Source: Public Records
Mortgage History
| Date | Status | Borrower | Loan Amount |
|---|---|---|---|
| Open | Putt Around Llc | $647,000 | |
| Previous Owner | 81 Underpass Nt | $332,000 |
Source: Public Records
Tax History
| Year | Tax Paid | Tax Assessment Tax Assessment Total Assessment is a certain percentage of the fair market value that is determined by local assessors to be the total taxable value of land and additions on the property. | Land | Improvement |
|---|---|---|---|---|
| 2025 | $3,027 | $439,900 | $239,600 | $200,300 |
| 2024 | $2,208 | $324,300 | $230,300 | $94,000 |
| 2023 | $2,100 | $300,400 | $210,500 | $89,900 |
| 2022 | $2,082 | $265,200 | $183,200 | $82,000 |
| 2021 | $2,269 | $264,400 | $183,200 | $81,200 |
| 2020 | $1,138 | $261,100 | $183,200 | $77,900 |
| 2019 | $5,532 | $259,100 | $183,200 | $75,900 |
| 2018 | $2,126 | $257,400 | $183,200 | $74,200 |
| 2017 | $1,176 | $255,700 | $183,200 | $72,500 |
| 2016 | $2,113 | $250,700 | $179,700 | $71,000 |
| 2015 | $2,097 | $253,900 | $176,200 | $77,700 |
Source: Public Records
Map
Nearby Homes
- 23 Landing Ln Unit 23
- 103 Trevor Ln Unit 103
- 87 N Pond Dr
- 63 Trevor Ln Unit 63
- 2019 Main St
- 398 Lund Farm Way
- 100 Fletcher Ln Unit E
- 0 Old Chatham Rd
- 52 Eaton Ln Unit (52)
- 1861 Main St
- 235 Old Chatham Rd
- 127 Eaton Ln Unit 127
- 14 Howland Cir Unit 14
- 39 Spruce Run Dr
- 204 Eaton Ln Unit 204
- 958 Long Pond Rd
- 16 Commons Way
- 0 Commons Way Unit 22504099
- 1580 Main St
- 184 Barons Way
- 125 Underpass Rd
- 125 Underpass Rd Unit 3
- 125 Underpass Rd Unit 1
- 125 Underpass Rd
- 64 Sachemus Trail Unit 64
- 64 Sachemus Trail
- 64 Sachemus Trail
- 139 Underpass Rd
- 66 Sachemus Trail
- 48 Sachemus Trail
- 48 Sachemus Trail
- 44 Underpass Rd
- 70 Sachemus Trail
- 57 Sachemus Trail
- 42-44 Underpass Rd
- 84 Underpass Rd Unit 7
- 84 Underpass Rd
- 44 Sachemus Trail
- 72 Sachemus Trail Unit 72
- 72 Sachemus Trail Unit 72
Your Personal Tour Guide
Ask me questions while you tour the home.