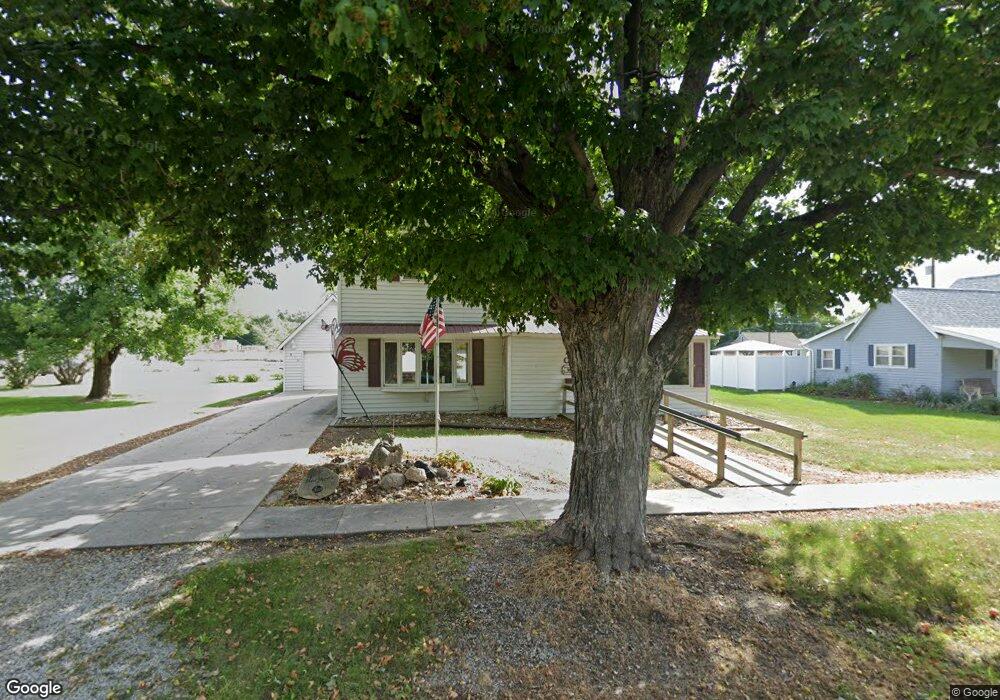
810 S 9th Ave Vinton, IA 52349
Estimated Value: $102,940 - $135,000
3
Beds
1
Bath
1,093
Sq Ft
$104/Sq Ft
Est. Value
About This Home
This home is located at 810 S 9th Ave, Vinton, IA 52349 and is currently estimated at $113,985, approximately $104 per square foot. 810 S 9th Ave is a home located in Benton County with nearby schools including Tilford Elementary School, Shellsburg Elementary School, and Vinton-Shellsburg Middle School.
Ownership History
Date
Name
Owned For
Owner Type
Purchase Details
Closed on
Aug 7, 2023
Sold by
Haefner Donald I
Bought by
Bee Katrina
Current Estimated Value
Home Financials for this Owner
Home Financials are based on the most recent Mortgage that was taken out on this home.
Original Mortgage
$78,300
Outstanding Balance
$76,516
Interest Rate
6.81%
Mortgage Type
New Conventional
Estimated Equity
$37,469
Create a Home Valuation Report for This Property
The Home Valuation Report is an in-depth analysis detailing your home's value as well as a comparison with similar homes in the area
Home Values in the Area
Average Home Value in this Area
Purchase History
| Date | Buyer | Sale Price | Title Company |
|---|---|---|---|
| Bee Katrina | $87,000 | None Listed On Document |
Source: Public Records
Mortgage History
| Date | Status | Borrower | Loan Amount |
|---|---|---|---|
| Open | Bee Katrina | $78,300 |
Source: Public Records
Tax History Compared to Growth
Tax History
| Year | Tax Paid | Tax Assessment Tax Assessment Total Assessment is a certain percentage of the fair market value that is determined by local assessors to be the total taxable value of land and additions on the property. | Land | Improvement |
|---|---|---|---|---|
| 2025 | $1,508 | $100,500 | $15,600 | $84,900 |
| 2024 | $1,508 | $90,700 | $14,900 | $75,800 |
| 2023 | $1,320 | $90,700 | $14,900 | $75,800 |
| 2022 | $1,352 | $73,600 | $12,000 | $61,600 |
| 2021 | $1,352 | $73,600 | $12,000 | $61,600 |
| 2020 | $726 | $63,000 | $9,200 | $53,800 |
| 2019 | $832 | $60,000 | $9,200 | $50,800 |
| 2018 | $648 | $57,200 | $8,500 | $48,700 |
| 2017 | $648 | $57,200 | $8,500 | $48,700 |
| 2016 | $892 | $53,400 | $7,900 | $45,500 |
| 2015 | $892 | $53,400 | $7,900 | $45,500 |
| 2014 | $844 | $51,100 | $0 | $0 |
Source: Public Records
Map
Nearby Homes