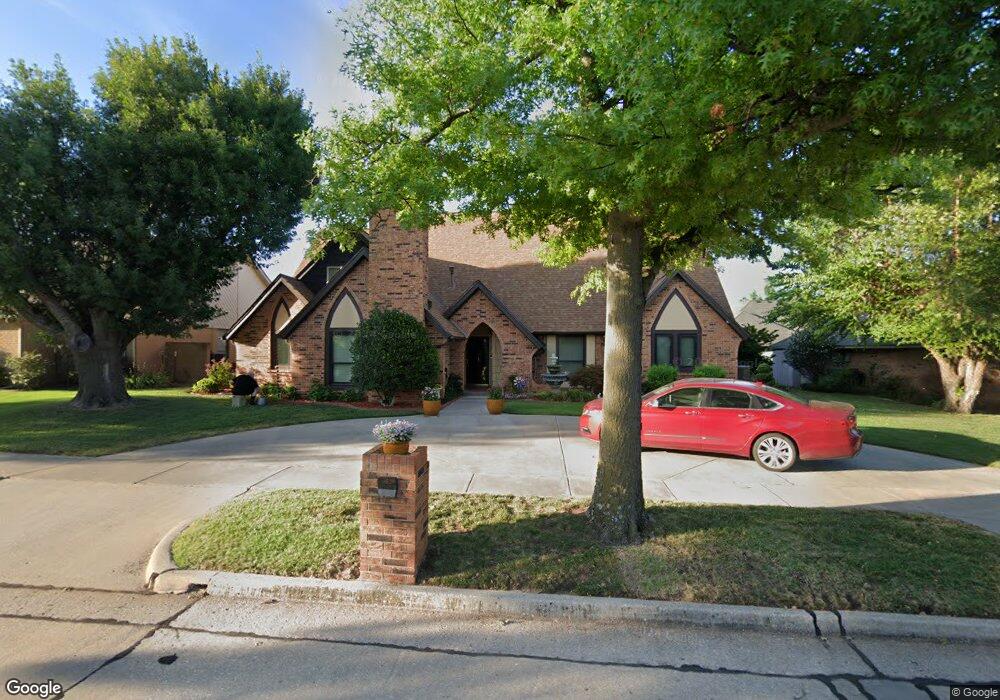
8108 N Bridgeport Ln Bethany, OK 73008
Estimated Value: $391,000 - $477,000
4
Beds
5
Baths
3,522
Sq Ft
$123/Sq Ft
Est. Value
About This Home
This home is located at 8108 N Bridgeport Ln, Bethany, OK 73008 and is currently estimated at $432,915, approximately $122 per square foot. 8108 N Bridgeport Ln is a home located in Oklahoma County with nearby schools including Overholser Elementary School, Western Oaks Middle School, and Putnam City West High School.
Ownership History
Date
Name
Owned For
Owner Type
Purchase Details
Closed on
Dec 1, 2021
Sold by
Neitzel Lynn L and Neitzel Rhonda J
Bought by
Neitzel Lynn L and Neitzel Rhonda J
Current Estimated Value
Purchase Details
Closed on
Oct 11, 2010
Sold by
Key Phoebe and Key William G
Bought by
Key Phoebe Lois and Phoebe Lois Key Revocable Trus
Purchase Details
Closed on
Sep 1, 2009
Sold by
Cobb Terri D and The Terri D Cobb Revocable Tru
Bought by
William G & Billie J Riggs Revocable Tru
Purchase Details
Closed on
Feb 27, 2004
Sold by
Cobb William L and Cobb Terri D
Bought by
Cobb Terri D
Purchase Details
Closed on
Nov 19, 2003
Sold by
Cobb William L and Cobb Terri D
Bought by
Cobb William L and Cobb Terri D
Purchase Details
Closed on
Sep 13, 2002
Sold by
Steele Bobbie and Steele Bobbie J
Bought by
The William L & Terri D Cobb Revocable T
Create a Home Valuation Report for This Property
The Home Valuation Report is an in-depth analysis detailing your home's value as well as a comparison with similar homes in the area
Home Values in the Area
Average Home Value in this Area
Purchase History
| Date | Buyer | Sale Price | Title Company |
|---|---|---|---|
| Neitzel Lynn L | -- | None Available | |
| Key Phoebe Lois | -- | None Available | |
| William G & Billie J Riggs Revocable Tru | $260,000 | Capitol Abstract & Title Co | |
| Cobb Terri D | -- | -- | |
| Cobb William L | -- | First American Title & Tr Co | |
| The William L & Terri D Cobb Revocable T | $250,000 | First Amer Title & Trust Co |
Source: Public Records
Tax History Compared to Growth
Tax History
| Year | Tax Paid | Tax Assessment Tax Assessment Total Assessment is a certain percentage of the fair market value that is determined by local assessors to be the total taxable value of land and additions on the property. | Land | Improvement |
|---|---|---|---|---|
| 2024 | $3,841 | $33,179 | $4,126 | $29,053 |
| 2023 | $3,841 | $32,213 | $3,367 | $28,846 |
| 2022 | $3,407 | $31,274 | $4,173 | $27,101 |
| 2021 | $3,291 | $30,364 | $4,316 | $26,048 |
| 2020 | $3,180 | $29,480 | $4,432 | $25,048 |
| 2019 | $3,094 | $28,820 | $5,512 | $23,308 |
| 2018 | $3,208 | $30,030 | $0 | $0 |
| 2017 | $3,331 | $30,964 | $5,512 | $25,452 |
| 2016 | $3,319 | $31,307 | $5,512 | $25,795 |
| 2015 | $3,207 | $31,307 | $5,376 | $25,931 |
| 2014 | $2,472 | $25,379 | $5,040 | $20,339 |
Source: Public Records
Map
Nearby Homes
- 8100 N Bridgeport Ln
- 8101 Brownsville Ln
- 8104 Brownsville Ln
- 3920 Patty Ln
- 7917 NW 40th St
- 3808 N Markwell Ave
- 8209 NW 38th St
- 3725 N Grant Ave
- 7800 NW 37th St
- 3120 N Pinecrest Dr
- 3108 N Grant Ave
- 7700 NW 31st St
- 7728 NW 30th St
- 7433 NW 31st St
- 2928 N Downing Ave
- 3707 Franks Way
- 2912 N Shannon Ave
- 7221 NW 46th St
- 8209 NW 28th St
- 7401 NW 30th Terrace
- 8104 N Bridgeport Ln
- 8112 N Bridgeport Ln
- 8109 Sunkist Ln
- 8105 Sunkist Ln
- 8113 N Bridgeport Ln
- 8109 N Bridgeport Ln
- 8116 N Bridgeport Ln
- 8113 Sunkist Ln
- 8117 N Bridgeport Ln
- 8101 Sunkist Ln
- 8105 N Bridgeport Ln
- 8121 N Bridgeport Ln
- 8200 N Bridgeport Ln
- 8101 N Bridgeport Ln
- 8104 Sunkist Ln
- 8117 Sunkist Ln
- 8205 Brownsville Ln
- 4108 Patty Ln
- 8201 N Bridgeport Ln
- 8100 Sunkist Ln