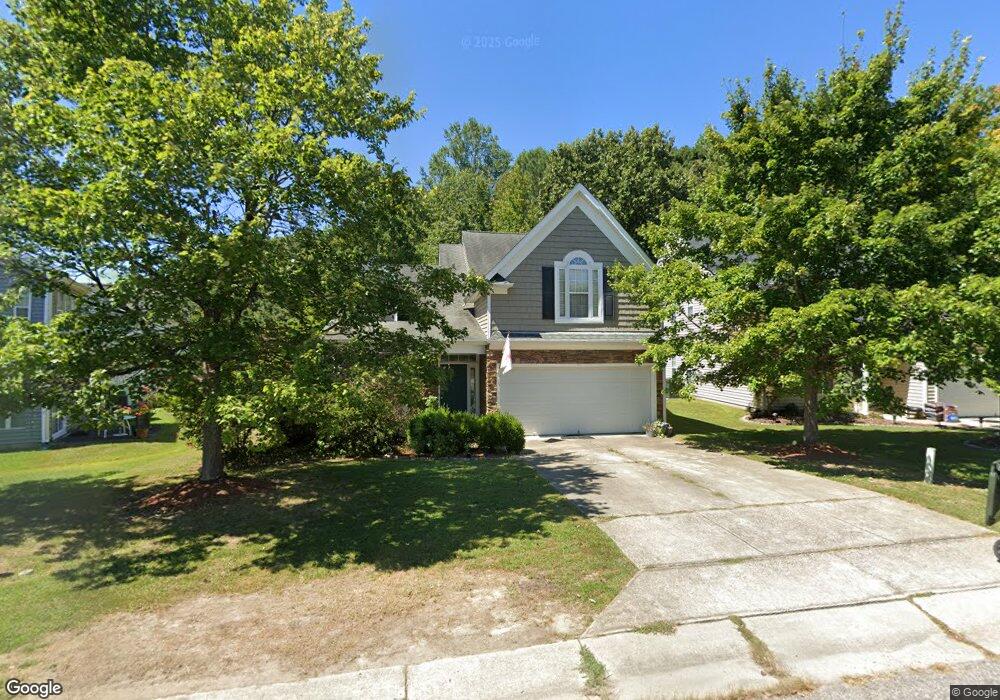
8109 Rolling Glenn Dr Raleigh, NC 27616
Forestville NeighborhoodEstimated Value: $372,865 - $391,000
3
Beds
3
Baths
1,885
Sq Ft
$202/Sq Ft
Est. Value
About This Home
This home is located at 8109 Rolling Glenn Dr, Raleigh, NC 27616 and is currently estimated at $380,966, approximately $202 per square foot. 8109 Rolling Glenn Dr is a home located in Wake County with nearby schools including Harris Creek Elementary School, Rolesville Middle School, and Rolesville High School.
Ownership History
Date
Name
Owned For
Owner Type
Purchase Details
Closed on
May 20, 2020
Sold by
Munoz Raul D and Munoz Martha Roxana
Bought by
Stovel Nina
Current Estimated Value
Home Financials for this Owner
Home Financials are based on the most recent Mortgage that was taken out on this home.
Original Mortgage
$249,775
Outstanding Balance
$220,917
Interest Rate
3.2%
Mortgage Type
New Conventional
Estimated Equity
$160,049
Purchase Details
Closed on
Aug 8, 2014
Sold by
Godwin William Robert and Godwin Brittany Gottenborg
Bought by
Munoz Raul D and Munoz Martha Roxana
Home Financials for this Owner
Home Financials are based on the most recent Mortgage that was taken out on this home.
Original Mortgage
$193,171
Interest Rate
4.19%
Mortgage Type
VA
Purchase Details
Closed on
Nov 20, 2009
Sold by
Omalley Cora
Bought by
Godwin William Robert and Godwin Brittany Gottenborg
Home Financials for this Owner
Home Financials are based on the most recent Mortgage that was taken out on this home.
Original Mortgage
$192,857
Interest Rate
4.92%
Mortgage Type
New Conventional
Create a Home Valuation Report for This Property
The Home Valuation Report is an in-depth analysis detailing your home's value as well as a comparison with similar homes in the area
Home Values in the Area
Average Home Value in this Area
Purchase History
| Date | Buyer | Sale Price | Title Company |
|---|---|---|---|
| Stovel Nina | $257,500 | None Available | |
| Munoz Raul D | $187,000 | None Available | |
| Godwin William Robert | $189,000 | None Available |
Source: Public Records
Mortgage History
| Date | Status | Borrower | Loan Amount |
|---|---|---|---|
| Open | Stovel Nina | $249,775 | |
| Previous Owner | Munoz Raul D | $193,171 | |
| Previous Owner | Godwin William Robert | $192,857 |
Source: Public Records
Tax History Compared to Growth
Tax History
| Year | Tax Paid | Tax Assessment Tax Assessment Total Assessment is a certain percentage of the fair market value that is determined by local assessors to be the total taxable value of land and additions on the property. | Land | Improvement |
|---|---|---|---|---|
| 2025 | $3,087 | $351,646 | $90,000 | $261,646 |
| 2024 | $3,074 | $351,646 | $90,000 | $261,646 |
| 2023 | $2,603 | $237,005 | $45,000 | $192,005 |
| 2022 | $2,420 | $237,005 | $45,000 | $192,005 |
| 2021 | $2,326 | $237,005 | $45,000 | $192,005 |
| 2020 | $2,284 | $237,005 | $45,000 | $192,005 |
| 2019 | $2,170 | $185,511 | $45,000 | $140,511 |
| 2018 | $2,047 | $185,511 | $45,000 | $140,511 |
| 2017 | $1,950 | $185,511 | $45,000 | $140,511 |
| 2016 | $1,910 | $185,511 | $45,000 | $140,511 |
| 2015 | $1,932 | $184,622 | $44,000 | $140,622 |
| 2014 | -- | $184,622 | $44,000 | $140,622 |
Source: Public Records
Map
Nearby Homes
- 3904 Leeson Trail
- 7528 Argent Valley Dr
- 8005 Caliber Woods Dr
- 8520 Quarton Dr
- 8117 Bright Oak Trail
- 2821 Casona Way
- 4007 Newell Ln
- 4017 Rothfield Ln
- 8341 Hollister Hills Dr
- 3605 Iron Sight Ct
- 3617 Jordan Mill Ct
- 2716 Sammish Way
- 2726 Sammish Way
- 2718 Sammish Way
- 2730 Sammish Way
- 2724 Way
- 4140 Stells Rd
- 8504 Lasilla Way
- 3665 Watkins Ridge Ct
- 8724 Wardle Ct
- 8113 Rolling Glenn Dr
- 7831 Braefield Dr
- 7827 Braefield Dr
- 8117 Rolling Glenn Dr
- 7823 Braefield Dr
- 8108 Rolling Glenn Dr
- 8112 Rolling Glenn Dr
- 8104 Rolling Glenn Dr
- 8121 Rolling Glenn Dr
- 7819 Braefield Dr
- 8116 Rolling Glenn Dr
- 8125 Rolling Glenn Dr
- 7838 Braefield Dr
- 7830 Braefield Dr
- 8120 Rolling Glenn Dr
- 7815 Braefield Dr
- 7822 Braefield Dr
- 7842 Braefield Dr
- 8111 Willowglen Dr
- 8105 Willowglen Dr