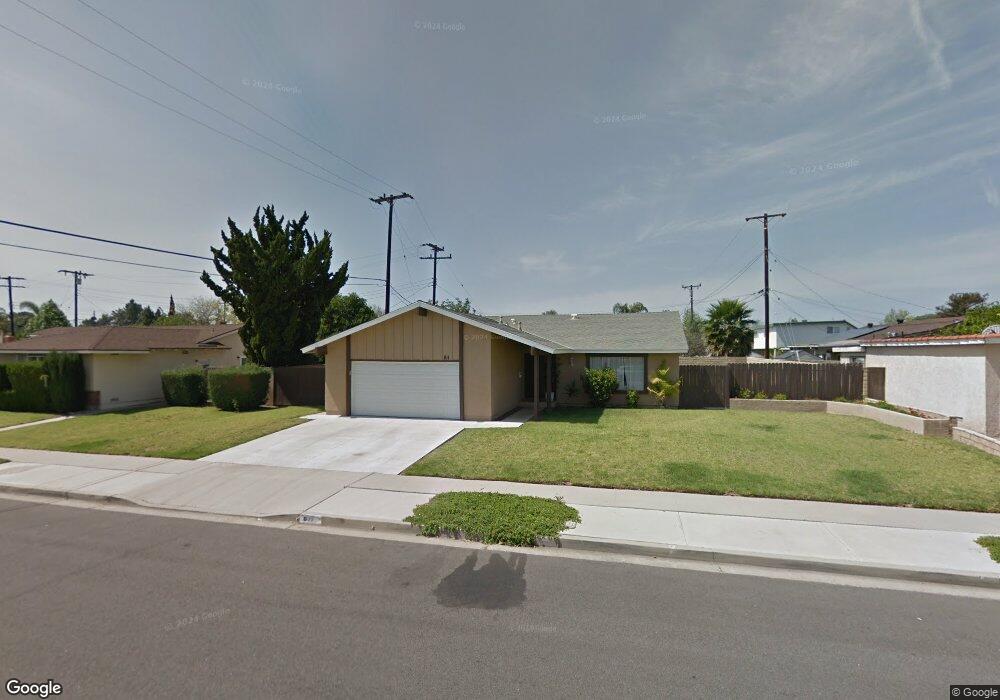
811 Brently Ave Camarillo, CA 93010
Estimated Value: $837,000 - $904,000
3
Beds
2
Baths
1,469
Sq Ft
$599/Sq Ft
Est. Value
About This Home
This home is located at 811 Brently Ave, Camarillo, CA 93010 and is currently estimated at $879,260, approximately $598 per square foot. 811 Brently Ave is a home located in Ventura County with nearby schools including Monte Vista Middle School, University Preparation Charter School at CSU Channel Islands, and Camarillo Academy of Progressive Education.
Ownership History
Date
Name
Owned For
Owner Type
Purchase Details
Closed on
Aug 26, 2014
Sold by
Westbrooks Lamie A and Westbrooks Kelly
Bought by
Westbrooks Jamie A and Westbrooks Kelly
Current Estimated Value
Home Financials for this Owner
Home Financials are based on the most recent Mortgage that was taken out on this home.
Original Mortgage
$405,000
Interest Rate
4.2%
Mortgage Type
New Conventional
Purchase Details
Closed on
Nov 1, 2006
Sold by
Westbrooks Jamie A
Bought by
Westbrooks Jamie A and Orvis Kelly
Purchase Details
Closed on
Jun 14, 2002
Sold by
Westbrooks Jamie A and Westbrooks Toby L
Bought by
Westbrooks Jaime A
Home Financials for this Owner
Home Financials are based on the most recent Mortgage that was taken out on this home.
Original Mortgage
$240,000
Interest Rate
5.87%
Create a Home Valuation Report for This Property
The Home Valuation Report is an in-depth analysis detailing your home's value as well as a comparison with similar homes in the area
Home Values in the Area
Average Home Value in this Area
Purchase History
| Date | Buyer | Sale Price | Title Company |
|---|---|---|---|
| Westbrooks Jamie A | -- | Vantage Point Title | |
| Westbrooks Jamie A | -- | Accommodation | |
| Westbrooks Jaime A | -- | Commonwealth Land Title Co |
Source: Public Records
Mortgage History
| Date | Status | Borrower | Loan Amount |
|---|---|---|---|
| Closed | Westbrooks Jamie A | $405,000 | |
| Closed | Westbrooks Jaime A | $240,000 |
Source: Public Records
Tax History Compared to Growth
Tax History
| Year | Tax Paid | Tax Assessment Tax Assessment Total Assessment is a certain percentage of the fair market value that is determined by local assessors to be the total taxable value of land and additions on the property. | Land | Improvement |
|---|---|---|---|---|
| 2025 | $3,955 | $362,410 | $144,964 | $217,446 |
| 2024 | $3,955 | $355,304 | $142,121 | $213,183 |
| 2023 | $3,813 | $348,338 | $139,335 | $209,003 |
| 2022 | $3,800 | $341,508 | $136,603 | $204,905 |
| 2021 | $3,663 | $334,812 | $133,924 | $200,888 |
| 2020 | $3,649 | $331,380 | $132,551 | $198,829 |
| 2019 | $3,631 | $324,883 | $129,952 | $194,931 |
| 2018 | $3,563 | $318,513 | $127,404 | $191,109 |
| 2017 | $3,354 | $312,268 | $124,906 | $187,362 |
| 2016 | $3,273 | $306,146 | $122,457 | $183,689 |
| 2015 | $3,238 | $301,549 | $120,618 | $180,931 |
| 2014 | $3,162 | $295,644 | $118,256 | $177,388 |
Source: Public Records
Map
Nearby Homes
- 745 Guy Turner Dr
- 741 Guy Turner Dr
- 755 Guy Turner Dr
- 729 Mardigras Ct
- 865 Mobil Ave
- 1892 Dunnigan St
- 1265 Bedford Dr
- 1208 Coe St
- 2104 Dunnigan St
- 1566 Edgemont Dr
- 2174 Wilcox St
- 876 Palmer Ave
- 1917 Colonia Place
- 748 Edward Scholle Dr
- 740 Edward Scholle Dr
- 860 Big Horn Ct
- 1075 Seybolt Ave
- 1709 Las Posas Rd
- 1150 Ventura Blvd Unit 126
- 1150 Ventura Blvd Unit 109
- 787 Brently Ave
- 1790 Burnley St
- 1693 Darnell Ct
- 1772 Burnley St
- 1754 Burnley St
- 810 Brently Ave
- 1683 Darnell Ct
- 822 Brently Ave
- 755 Brently Ave
- 1694 Darnell Ct
- 798 Brently Ave
- 844 Brently Ave
- 1726 Burnley St
- 786 Brently Ave
- 881 Brently Ave
- 866 Brently Ave
- 1682 Darnell Ct
- 1671 Darnell Ct
- 770 Brently Ave
- 809 Duvall Ave