Estimated Value: $612,296 - $681,000
3
Beds
2
Baths
3,409
Sq Ft
$188/Sq Ft
Est. Value
About This Home
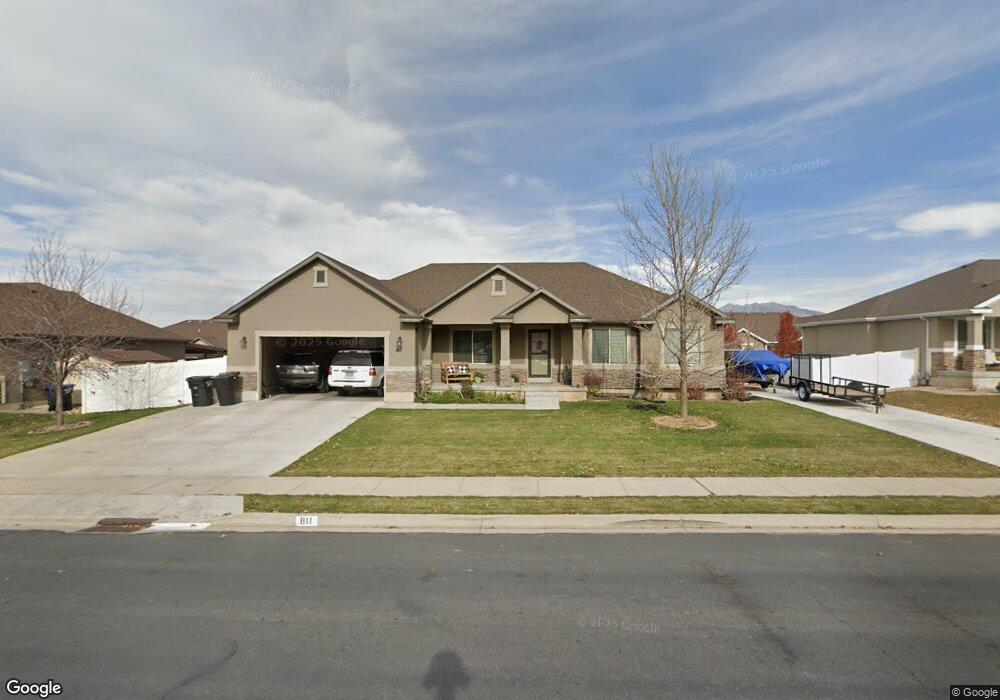
This home is located at 811 E 180 N Unit 70, Salem, UT 84653 and is currently estimated at $640,765, approximately $187 per square foot. 811 E 180 N Unit 70 is a home located in Utah County with nearby schools including Salem Elementary, Valley View Middle School, and Salem Junior High School.
Ownership History
Date
Name
Owned For
Owner Type
Purchase Details
Closed on
Jan 17, 2014
Sold by
Hansen David
Bought by
Hansen David and Hansen Susan B
Current Estimated Value
Home Financials for this Owner
Home Financials are based on the most recent Mortgage that was taken out on this home.
Original Mortgage
$133,773
Outstanding Balance
$67,403
Interest Rate
4.46%
Mortgage Type
New Conventional
Estimated Equity
$573,362
Purchase Details
Closed on
Jan 15, 2014
Sold by
Arive Homes Llc
Bought by
Hansen David
Home Financials for this Owner
Home Financials are based on the most recent Mortgage that was taken out on this home.
Original Mortgage
$133,773
Outstanding Balance
$67,403
Interest Rate
4.46%
Mortgage Type
New Conventional
Estimated Equity
$573,362
Purchase Details
Closed on
Aug 8, 2013
Sold by
Salem Hills Llc
Bought by
Arive Homes Llc
Home Financials for this Owner
Home Financials are based on the most recent Mortgage that was taken out on this home.
Original Mortgage
$237,800
Interest Rate
4.46%
Mortgage Type
Construction
Create a Home Valuation Report for This Property
The Home Valuation Report is an in-depth analysis detailing your home's value as well as a comparison with similar homes in the area
Home Values in the Area
Average Home Value in this Area
Purchase History
| Date | Buyer | Sale Price | Title Company |
|---|---|---|---|
| Hansen David | -- | Provo Land Title Co | |
| Hansen David | -- | Provo Land Title Co | |
| Arive Homes Llc | -- | Provo Land Title Company |
Source: Public Records
Mortgage History
| Date | Status | Borrower | Loan Amount |
|---|---|---|---|
| Open | Hansen David | $133,773 | |
| Previous Owner | Arive Homes Llc | $237,800 |
Source: Public Records
Tax History
| Year | Tax Paid | Tax Assessment Tax Assessment Total Assessment is a certain percentage of the fair market value that is determined by local assessors to be the total taxable value of land and additions on the property. | Land | Improvement |
|---|---|---|---|---|
| 2025 | $2,764 | $309,485 | -- | -- |
| 2024 | $2,764 | $280,280 | $0 | $0 |
| 2023 | $2,778 | $282,260 | $0 | $0 |
| 2022 | $3,130 | $313,115 | $0 | $0 |
| 2021 | $2,448 | $392,900 | $129,400 | $263,500 |
| 2020 | $2,374 | $370,800 | $112,500 | $258,300 |
| 2019 | $2,098 | $334,700 | $108,900 | $225,800 |
| 2018 | $1,954 | $297,800 | $98,000 | $199,800 |
| 2017 | $1,941 | $157,795 | $0 | $0 |
| 2016 | $1,906 | $153,175 | $0 | $0 |
| 2015 | $1,864 | $147,180 | $0 | $0 |
| 2014 | $1,819 | $143,825 | $0 | $0 |
Source: Public Records
Map
Nearby Homes
- 2165 E 270 N Unit MSF47
- 2153 E 270 N Unit MSF48
- 2152 E 270 N Unit MSF50
- 2174 E 270 N Unit MSF51
- 2148 E 270 N Unit MSF49
- 643-1209 N 1850 E
- 384 N 710 E
- 6 Shady Ln
- 659-1205 N 1850 E
- 974 E 400 St N
- 974 E 400 St N Unit 1
- 88 S 850 E
- 663-1204 N 1850 E
- 84 N 500 E
- 647-1208 N 1850 E
- 438 N 500 E Unit LOT 2
- 315 N 500 E
- 644 N 500 E Unit 111
- 513 E 400 North St
- 846 E 400 St N
- 811 E 180 N Unit 88
- 814 E 220 N Unit 61
- 814 E 220 N
- 795 E 180 N Unit 71
- 833 E 180 N Unit 69
- 796 E 220 N
- 832 E 220 N Unit 62
- 832 E 220 N
- 162 N 800 E Unit 90
- 162 N 800 E
- 163 N 850 E Unit 101
- 851 E 180 N
- 851 E 180 N Unit 68
- 167 N 800 E Unit 77
- 852 E 220 N
- 852 E 220 N Unit 63
- 807 E 220 N
- 146 N 800 E Unit 91
- 763 E 180 N Unit 72
- 821 E 220 N
Your Personal Tour Guide
Ask me questions while you tour the home.