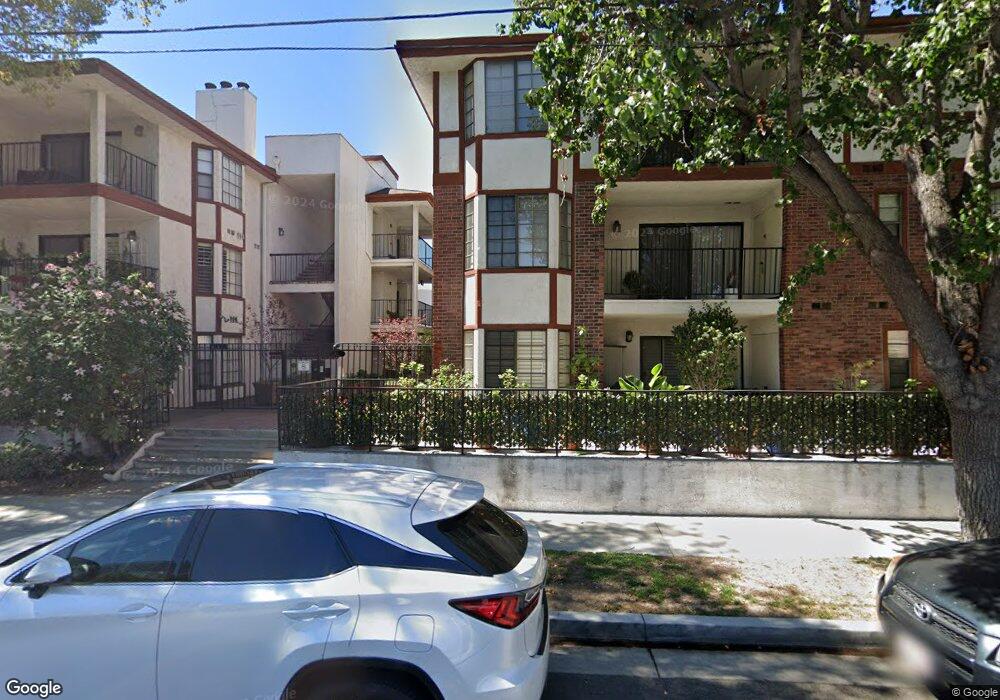
811 N Columbus Ave Unit 10 Glendale, CA 91203
Estimated Value: $641,610 - $725,000
2
Beds
2
Baths
1,277
Sq Ft
$541/Sq Ft
Est. Value
About This Home
This home is located at 811 N Columbus Ave Unit 10, Glendale, CA 91203 and is currently estimated at $691,403, approximately $541 per square foot. 811 N Columbus Ave Unit 10 is a home located in Los Angeles County with nearby schools including Balboa Elementary School, Eleanor J. Toll Middle School, and Herbert Hoover High School.
Ownership History
Date
Name
Owned For
Owner Type
Purchase Details
Closed on
Sep 16, 2014
Sold by
Dorich Anita and Mildred Radovich Trust
Bought by
Dorich Anita and The Dorich Family Trust
Current Estimated Value
Purchase Details
Closed on
May 3, 2006
Sold by
Radovich John and Kollias Mary Ann
Bought by
Radovich Mildred
Purchase Details
Closed on
Apr 24, 2006
Sold by
Radovich Mildred
Bought by
Radovich Mildred and The Mildred Radovich Trust
Purchase Details
Closed on
Jul 23, 2003
Sold by
Radovich John
Bought by
Radovich John and Kollias Mary Ann
Purchase Details
Closed on
Mar 5, 2002
Sold by
Dorich William and Dorich Anita
Bought by
Dorich William and Dorich Anita
Purchase Details
Closed on
Jun 10, 1997
Sold by
Radovich Mildred
Bought by
Radovich Mildred and Dorich Anita
Purchase Details
Closed on
Jun 2, 1997
Sold by
Radovich Mary
Bought by
Radovich John R
Purchase Details
Closed on
Jun 21, 1996
Sold by
Obradovich Dositei
Bought by
Radovich Mildred
Create a Home Valuation Report for This Property
The Home Valuation Report is an in-depth analysis detailing your home's value as well as a comparison with similar homes in the area
Home Values in the Area
Average Home Value in this Area
Purchase History
| Date | Buyer | Sale Price | Title Company |
|---|---|---|---|
| Dorich Anita | -- | None Available | |
| Radovich Mildred | -- | None Available | |
| Radovich Mildred | -- | None Available | |
| Radovich John | -- | -- | |
| Dorich William | -- | -- | |
| Radovich Mildred | -- | -- | |
| Radovich John R | -- | -- | |
| Radovich Mildred | -- | -- |
Source: Public Records
Tax History Compared to Growth
Tax History
| Year | Tax Paid | Tax Assessment Tax Assessment Total Assessment is a certain percentage of the fair market value that is determined by local assessors to be the total taxable value of land and additions on the property. | Land | Improvement |
|---|---|---|---|---|
| 2025 | $2,328 | $212,479 | $62,068 | $150,411 |
| 2024 | $2,328 | $208,313 | $60,851 | $147,462 |
| 2023 | $2,275 | $204,229 | $59,658 | $144,571 |
| 2022 | $2,231 | $200,226 | $58,489 | $141,737 |
| 2021 | $2,186 | $196,301 | $57,343 | $138,958 |
| 2019 | $2,101 | $190,482 | $55,644 | $134,838 |
| 2018 | $2,063 | $186,748 | $54,553 | $132,195 |
| 2016 | $1,953 | $179,498 | $52,436 | $127,062 |
| 2015 | $1,914 | $176,803 | $51,649 | $125,154 |
| 2014 | $1,902 | $173,341 | $50,638 | $122,703 |
Source: Public Records
Map
Nearby Homes
- 409 Burchett St Unit 315
- 409 Burchett St Unit 220
- 811 N Columbus Ave Unit 18
- 408 Burchett St Unit 5
- 365 Burchett St Unit 303
- 350 Burchett St Unit 101
- 330 Burchett St Unit 206
- 345 Pioneer Dr Unit 1201
- 345 Pioneer Dr Unit 1705
- 343 Pioneer Dr Unit 905
- 343 Pioneer Dr Unit 504
- 501 W Doran St
- 451 Palm Dr
- 1207 N Columbus Ave
- 648 Pioneer Dr
- 530 W Stocker St Unit 203
- 1118 N Central Ave Unit 17
- 1118 N Central Ave Unit 14
- 248 W Loraine St Unit 107
- 588 South St
- 811 N Columbus Ave Unit 6
- 811 N Columbus Ave Unit 5
- 811 N Columbus Ave Unit 4
- 811 N Columbus Ave Unit 3
- 811 N Columbus Ave Unit 2
- 811 N Columbus Ave Unit 1
- 811 N Columbus Ave Unit 22
- 811 N Columbus Ave Unit 21
- 811 N Columbus Ave Unit 20
- 811 N Columbus Ave Unit 19
- 811 N Columbus Ave Unit 17
- 811 N Columbus Ave Unit 16
- 811 N Columbus Ave Unit 15
- 811 N Columbus Ave Unit 14
- 811 N Columbus Ave Unit 13
- 811 N Columbus Ave Unit 12
- 811 N Columbus Ave Unit 11
- 811 N Columbus Ave Unit 9
- 811 N Columbus Ave Unit 8
- 811 N Columbus Ave Unit 7