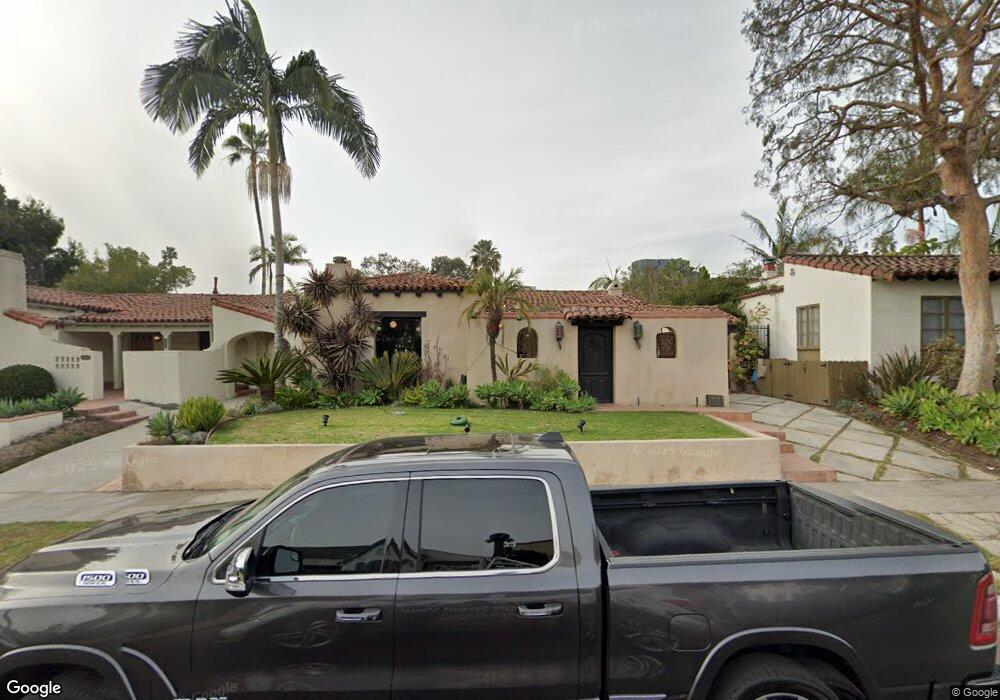
811 S Spaulding Ave Los Angeles, CA 90036
Miracle Mile NeighborhoodEstimated Value: $1,615,640 - $2,369,000
3
Beds
2
Baths
1,932
Sq Ft
$1,018/Sq Ft
Est. Value
About This Home
This home is located at 811 S Spaulding Ave, Los Angeles, CA 90036 and is currently estimated at $1,966,160, approximately $1,017 per square foot. 811 S Spaulding Ave is a home located in Los Angeles County with nearby schools including Carthay Environmental Studies Stem Magnet, Fairfax High School, and Cheder Of Los Angeles.
Ownership History
Date
Name
Owned For
Owner Type
Purchase Details
Closed on
Sep 18, 2010
Sold by
Meller Jerry P
Bought by
Meller Jerry P and The Meller Trust
Current Estimated Value
Purchase Details
Closed on
Dec 21, 1995
Sold by
Combrouze Laurence
Bought by
Nicholas Edward Angelo and Nicholas Laura Ann
Home Financials for this Owner
Home Financials are based on the most recent Mortgage that was taken out on this home.
Original Mortgage
$267,200
Outstanding Balance
$3,652
Interest Rate
7.36%
Estimated Equity
$1,962,508
Purchase Details
Closed on
Oct 18, 1994
Sold by
Yon Yves
Bought by
Combrouze Laurence
Purchase Details
Closed on
Aug 18, 1994
Sold by
The Prudential Home Mtg Company
Bought by
Yon Yves
Home Financials for this Owner
Home Financials are based on the most recent Mortgage that was taken out on this home.
Original Mortgage
$193,600
Interest Rate
8.5%
Purchase Details
Closed on
May 20, 1994
Sold by
T D Service Company
Bought by
The Prudential Home Mtg Company
Create a Home Valuation Report for This Property
The Home Valuation Report is an in-depth analysis detailing your home's value as well as a comparison with similar homes in the area
Home Values in the Area
Average Home Value in this Area
Purchase History
| Date | Buyer | Sale Price | Title Company |
|---|---|---|---|
| Meller Jerry P | -- | None Available | |
| Nicholas Edward Angelo | $334,000 | -- | |
| Combrouze Laurence | -- | -- | |
| Yon Yves | $242,000 | Old Republic Title Company | |
| The Prudential Home Mtg Company | $242,900 | World Title Company |
Source: Public Records
Mortgage History
| Date | Status | Borrower | Loan Amount |
|---|---|---|---|
| Open | Nicholas Edward Angelo | $267,200 | |
| Previous Owner | Yon Yves | $193,600 | |
| Closed | Nicholas Edward Angelo | $33,400 |
Source: Public Records
Tax History
| Year | Tax Paid | Tax Assessment Tax Assessment Total Assessment is a certain percentage of the fair market value that is determined by local assessors to be the total taxable value of land and additions on the property. | Land | Improvement |
|---|---|---|---|---|
| 2025 | $6,855 | $554,839 | $342,876 | $211,963 |
| 2024 | $6,855 | $543,960 | $336,153 | $207,807 |
| 2023 | $6,729 | $533,295 | $329,562 | $203,733 |
| 2022 | $6,425 | $522,839 | $323,100 | $199,739 |
| 2021 | $6,337 | $512,588 | $316,765 | $195,823 |
| 2019 | $6,152 | $497,386 | $307,370 | $190,016 |
| 2018 | $6,071 | $487,635 | $301,344 | $186,291 |
| 2016 | $5,797 | $468,702 | $289,644 | $179,058 |
| 2015 | $5,713 | $461,663 | $285,294 | $176,369 |
| 2014 | $5,739 | $452,621 | $279,706 | $172,915 |
Source: Public Records
Map
Nearby Homes
- 854 Alandele Ave
- 728 S Genesee Ave
- 819 S Curson Ave
- 738 S Ogden Dr
- 5815 W Olympic Blvd
- 923 S Ogden Dr
- 741 S Curson Ave
- 5761 W Olympic Blvd
- 1133 Spaulding Ave Unit 4
- 637 S Fairfax Ave Unit 202
- 1159 S Sierra Bonita Ave
- 6152 Orange St
- 6122 W 6th St
- 935 S Burnside Ave
- 6151 Orange St Unit 215
- 6151 Orange St Unit 107
- 1174 Carmona Ave
- 5558 Edgewood Place
- 1185 Hauser Blvd
- 1110 Hi Point St
- 805 S Spaulding Ave
- 801 S Spaulding Ave
- 821 S Spaulding Ave
- 802 S Genesee Ave
- 808 S Genesee Ave
- 812 S Genesee Ave
- 827 S Spaulding Ave
- 812 S Spaulding Ave
- 816 S Spaulding Ave
- 806 S Spaulding Ave
- 822 S Spaulding Ave
- 752 S Genesee Ave
- 816 S Genesee Ave
- 753 S Spaulding Ave
- 831 S Spaulding Ave
- 826 S Spaulding Ave
- 802 S Spaulding Ave
- 820 S Genesee Ave
- 746 S Genesee Ave
- 805 S Genesee Ave
Your Personal Tour Guide
Ask me questions while you tour the home.