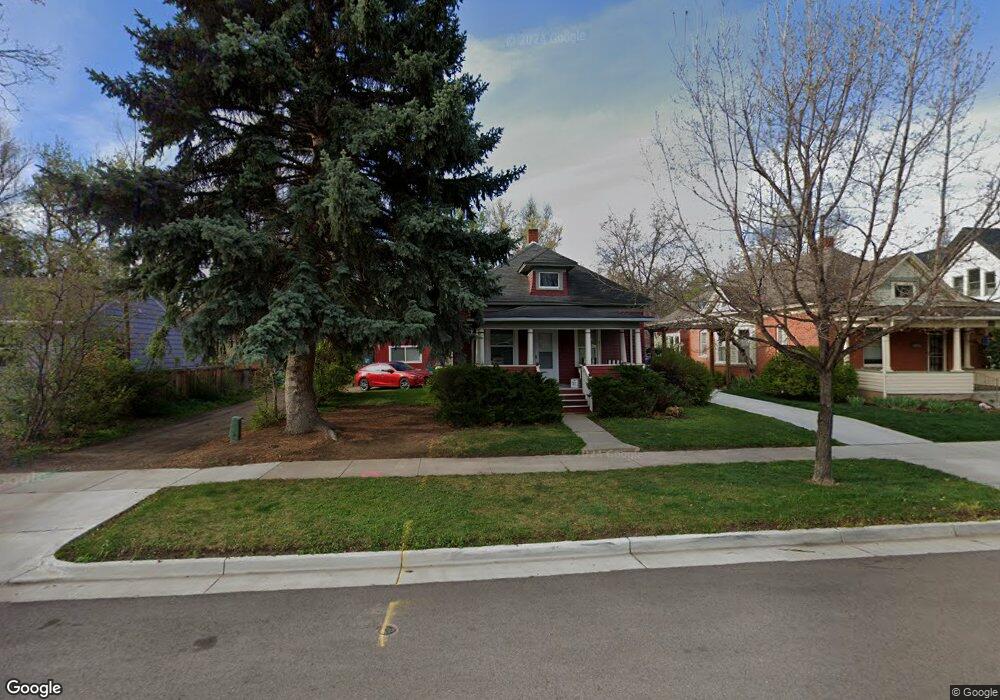
811 W Oak St Fort Collins, CO 80521
Old Town West NeighborhoodEstimated Value: $534,018 - $644,000
2
Beds
1
Bath
864
Sq Ft
$681/Sq Ft
Est. Value
About This Home
This home is located at 811 W Oak St, Fort Collins, CO 80521 and is currently estimated at $588,755, approximately $681 per square foot. 811 W Oak St is a home located in Larimer County with nearby schools including Dunn Elementary School, Lincoln Middle School, and Poudre High School.
Ownership History
Date
Name
Owned For
Owner Type
Purchase Details
Closed on
Oct 29, 2024
Sold by
Mathis Sean and Mathis Sean Michael
Bought by
Mathis Sean Michael and Mathis Linda Michelle
Current Estimated Value
Home Financials for this Owner
Home Financials are based on the most recent Mortgage that was taken out on this home.
Original Mortgage
$273,200
Outstanding Balance
$270,465
Interest Rate
6.09%
Mortgage Type
New Conventional
Estimated Equity
$318,290
Purchase Details
Closed on
May 20, 2019
Sold by
Burke Sandra Jeanne
Bought by
Mathis Terry L
Purchase Details
Closed on
May 4, 2018
Sold by
Burke Sandra Jeanne and Mathis Terry L
Bought by
Mathis Terry L and Burke Sandra Jeanne
Home Financials for this Owner
Home Financials are based on the most recent Mortgage that was taken out on this home.
Original Mortgage
$609,000
Interest Rate
4.44%
Mortgage Type
Credit Line Revolving
Purchase Details
Closed on
Mar 23, 1998
Sold by
Mathis Jeanne R and Stimmel Sandra
Bought by
Stimmel Sandra and Burke Sandra Jean Mathis
Create a Home Valuation Report for This Property
The Home Valuation Report is an in-depth analysis detailing your home's value as well as a comparison with similar homes in the area
Home Values in the Area
Average Home Value in this Area
Purchase History
| Date | Buyer | Sale Price | Title Company |
|---|---|---|---|
| Mathis Sean Michael | -- | None Listed On Document | |
| Mathis Terry L | -- | None Available | |
| Mathis Terry L | -- | None Available | |
| Stimmel Sandra | -- | -- |
Source: Public Records
Mortgage History
| Date | Status | Borrower | Loan Amount |
|---|---|---|---|
| Open | Mathis Sean Michael | $273,200 | |
| Previous Owner | Mathis Terry L | $609,000 |
Source: Public Records
Tax History Compared to Growth
Tax History
| Year | Tax Paid | Tax Assessment Tax Assessment Total Assessment is a certain percentage of the fair market value that is determined by local assessors to be the total taxable value of land and additions on the property. | Land | Improvement |
|---|---|---|---|---|
| 2025 | $2,688 | $38,398 | $6,030 | $32,368 |
| 2024 | $2,846 | $41,560 | $6,030 | $35,530 |
| 2022 | $1,519 | $23,032 | $6,255 | $16,777 |
| 2021 | $1,535 | $23,695 | $6,435 | $17,260 |
| 2020 | $2,336 | $32,118 | $6,435 | $25,683 |
| 2019 | $2,346 | $32,118 | $6,435 | $25,683 |
| 2018 | $1,444 | $23,047 | $6,480 | $16,567 |
| 2017 | $1,439 | $23,047 | $6,480 | $16,567 |
| 2016 | $1,054 | $19,502 | $7,164 | $12,338 |
| 2015 | $1,046 | $23,100 | $7,160 | $15,940 |
| 2014 | $798 | $16,720 | $4,780 | $11,940 |
Source: Public Records
Map
Nearby Homes
- 1031 W Oak St
- 1101 W Oak St
- 1100 W Mulberry St
- 620 W Mulberry St
- 1029 Laporte Ave
- 530 Laporte Ave
- 816 Maple St
- 219 N Shields St
- 317 Wood St
- 1127 W Mulberry St
- 601 S Whitcomb St
- 401 W Mountain Ave Unit 301
- 620 Armstrong Ave
- 320 N Loomis Ave
- 313 N Whitcomb St
- 224 Canyon Ave Unit 628
- 224 Canyon Ave Unit 410
- 149 Sylvan Ct
- 1305 W Myrtle St
- 427 N Grant Ave