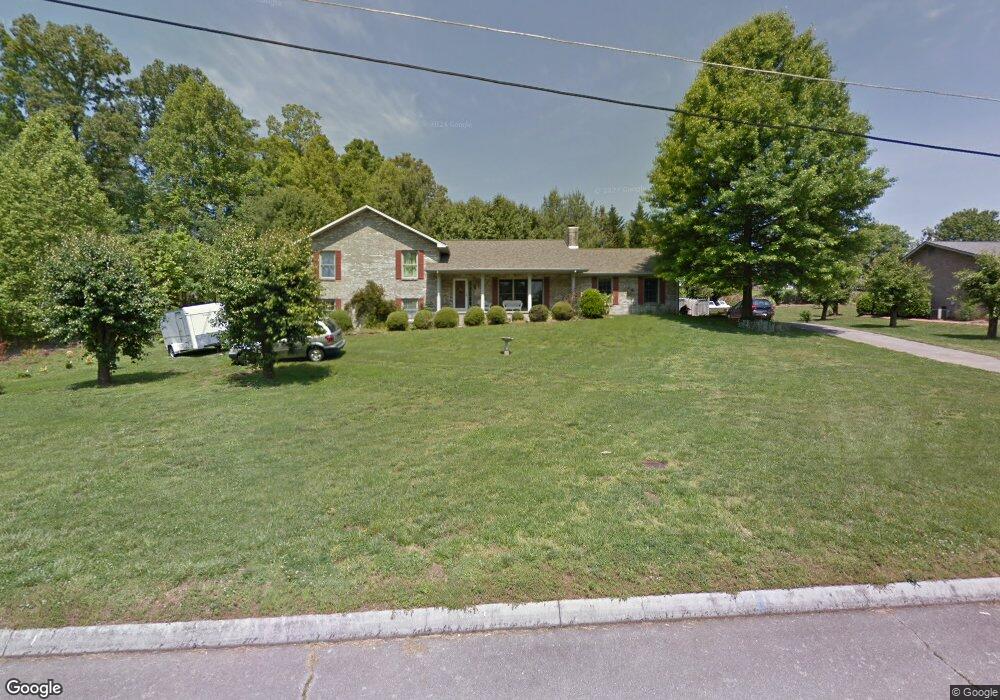
812 Berkay Ln Seymour, TN 37865
Estimated Value: $396,000 - $490,000
--
Bed
3
Baths
1,848
Sq Ft
$241/Sq Ft
Est. Value
About This Home
This home is located at 812 Berkay Ln, Seymour, TN 37865 and is currently estimated at $445,944, approximately $241 per square foot. 812 Berkay Ln is a home located in Blount County with nearby schools including Prospect Elementary School, Heritage Middle School, and Heritage High School.
Ownership History
Date
Name
Owned For
Owner Type
Purchase Details
Closed on
Jul 23, 2004
Sold by
Kech Katherine
Bought by
Hammond Douglas A
Current Estimated Value
Home Financials for this Owner
Home Financials are based on the most recent Mortgage that was taken out on this home.
Original Mortgage
$155,700
Interest Rate
5.63%
Purchase Details
Closed on
Jul 20, 2004
Sold by
Keech James W and Keech Katherine
Bought by
Hammond Douglas A
Home Financials for this Owner
Home Financials are based on the most recent Mortgage that was taken out on this home.
Original Mortgage
$155,700
Interest Rate
5.63%
Purchase Details
Closed on
Jul 7, 2000
Sold by
Edwards Arthur D and Edwards Betty J
Bought by
Keech James
Purchase Details
Closed on
Jun 4, 1993
Bought by
Clabo Clabo J and Clabo Fay
Purchase Details
Closed on
Mar 30, 1977
Bought by
Caylor L G
Create a Home Valuation Report for This Property
The Home Valuation Report is an in-depth analysis detailing your home's value as well as a comparison with similar homes in the area
Home Values in the Area
Average Home Value in this Area
Purchase History
| Date | Buyer | Sale Price | Title Company |
|---|---|---|---|
| Hammond Douglas A | $173,000 | -- | |
| Hammond Douglas A | $173,000 | -- | |
| Keech James | $175,000 | -- | |
| Clabo Clabo J | $17,000 | -- | |
| Caylor L G | -- | -- |
Source: Public Records
Mortgage History
| Date | Status | Borrower | Loan Amount |
|---|---|---|---|
| Closed | Caylor L G | $155,700 | |
| Closed | Caylor L G | $155,700 |
Source: Public Records
Tax History Compared to Growth
Tax History
| Year | Tax Paid | Tax Assessment Tax Assessment Total Assessment is a certain percentage of the fair market value that is determined by local assessors to be the total taxable value of land and additions on the property. | Land | Improvement |
|---|---|---|---|---|
| 2025 | $1,710 | $107,525 | $0 | $0 |
| 2024 | $1,710 | $107,525 | $12,500 | $95,025 |
| 2023 | $1,710 | $107,525 | $12,500 | $95,025 |
| 2022 | $1,494 | $60,475 | $7,500 | $52,975 |
| 2021 | $1,494 | $60,475 | $7,500 | $52,975 |
| 2020 | $1,494 | $60,475 | $7,500 | $52,975 |
| 2019 | $1,494 | $60,475 | $7,500 | $52,975 |
| 2018 | $1,278 | $51,750 | $5,000 | $46,750 |
| 2017 | $1,278 | $51,750 | $5,000 | $46,750 |
| 2016 | $1,278 | $51,750 | $5,000 | $46,750 |
| 2015 | $1,113 | $51,750 | $5,000 | $46,750 |
| 2014 | $1,132 | $51,750 | $5,000 | $46,750 |
| 2013 | $1,132 | $52,650 | $0 | $0 |
Source: Public Records
Map
Nearby Homes
- 862 Hinkle Estates Dr
- 827 Hinkle Estates Dr
- 634 Crestview Ct
- 830 Easey St
- 802 Hinkle Rd
- 715 Winston Dr
- 1137 Oakes Vista Ln
- 0 Miller Cir
- 727 Ic King Rd
- 516 Cherokee Hills Rd
- 5925 Sevierville Rd
- 534 Tennessee Cir
- 1137 Chris Wood Dr
- 516 Keck St
- 0 Burns Ln
- 6116 Nails Creek Rd
- 521 Devon St
- 372 Overlook Dr
- 401 Burns Ln
- 139 Creekwood Way
- 806 Berkay Ln
- 809 Hinkle Estates Dr
- 811 Berkay Ln
- 813 Hinkle Estates Dr
- 807 Hinkle Estates Dr
- 819 Berkay Ln
- 805 Berkay Ln
- 830 Berkay Ln
- 802 Berkay Ln
- 801 Hinkle Estates Dr
- 633 Sunrise Trail
- 833 Berkay Ln
- 810 Hinkle Estates Dr
- 806 Hinkle Estates Dr
- 814 Hinkle Estates Dr
- 872 Hinkle Estates Dr
- 636 Sunrise Trail
- 0 Hinkle Estates Dr
- 728 Quails Nest Ct
- 818 Hinkle Estates Dr