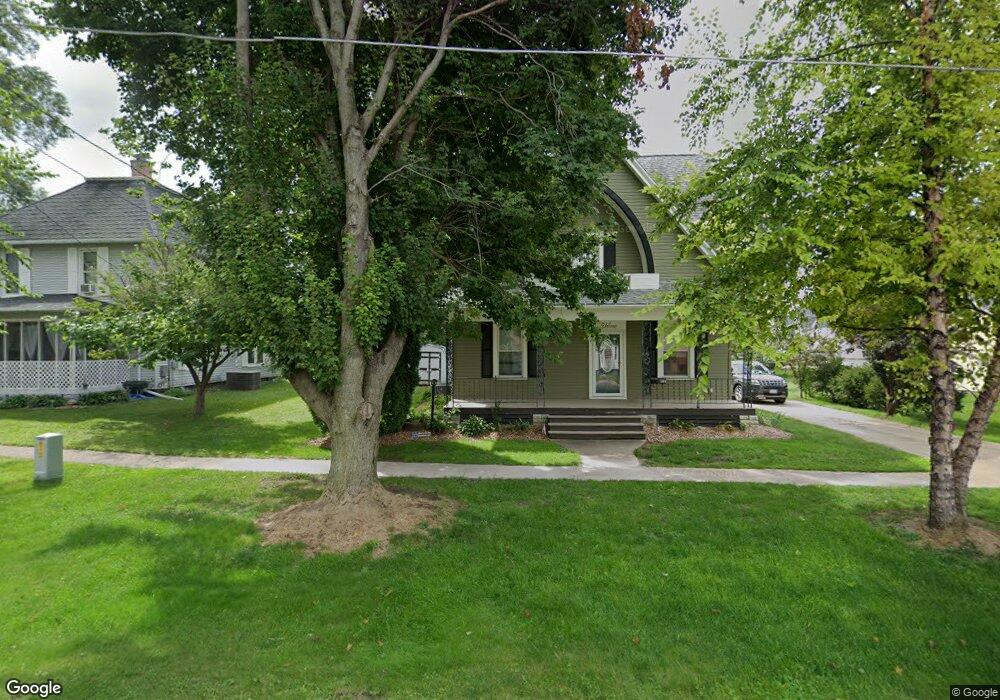
812 E 4th St Unit (24083275) Vinton, IA 52349
Estimated Value: $165,508 - $199,000
3
Beds
3
Baths
2,100
Sq Ft
$84/Sq Ft
Est. Value
About This Home
This home is located at 812 E 4th St Unit (24083275), Vinton, IA 52349 and is currently estimated at $177,127, approximately $84 per square foot. 812 E 4th St Unit (24083275) is a home located in Benton County with nearby schools including Tilford Elementary School, Shellsburg Elementary School, and Vinton-Shellsburg Middle School.
Ownership History
Date
Name
Owned For
Owner Type
Purchase Details
Closed on
Mar 9, 2006
Sold by
Hoffman John A and Hoffman Wendy S
Bought by
Roster Dustin J
Current Estimated Value
Home Financials for this Owner
Home Financials are based on the most recent Mortgage that was taken out on this home.
Original Mortgage
$72,800
Outstanding Balance
$41,265
Interest Rate
6.22%
Mortgage Type
New Conventional
Estimated Equity
$135,862
Create a Home Valuation Report for This Property
The Home Valuation Report is an in-depth analysis detailing your home's value as well as a comparison with similar homes in the area
Home Values in the Area
Average Home Value in this Area
Purchase History
| Date | Buyer | Sale Price | Title Company |
|---|---|---|---|
| Roster Dustin J | $91,000 | None Available |
Source: Public Records
Mortgage History
| Date | Status | Borrower | Loan Amount |
|---|---|---|---|
| Open | Roster Dustin J | $72,800 |
Source: Public Records
Tax History Compared to Growth
Tax History
| Year | Tax Paid | Tax Assessment Tax Assessment Total Assessment is a certain percentage of the fair market value that is determined by local assessors to be the total taxable value of land and additions on the property. | Land | Improvement |
|---|---|---|---|---|
| 2025 | $2,510 | $149,400 | $15,500 | $133,900 |
| 2024 | $2,510 | $134,000 | $14,900 | $119,100 |
| 2023 | $2,438 | $134,000 | $14,900 | $119,100 |
| 2022 | $2,502 | $113,300 | $11,900 | $101,400 |
| 2021 | $2,502 | $113,300 | $11,900 | $101,400 |
| 2020 | $2,460 | $122,500 | $13,900 | $108,600 |
| 2019 | $2,396 | $122,500 | $13,900 | $108,600 |
| 2018 | $2,322 | $117,800 | $13,400 | $104,400 |
| 2017 | $2,322 | $117,800 | $13,400 | $104,400 |
| 2016 | $2,188 | $110,100 | $12,500 | $97,600 |
| 2015 | $2,188 | $110,100 | $12,500 | $97,600 |
| 2014 | $1,928 | $97,900 | $0 | $0 |
Source: Public Records
Map
Nearby Homes