812 E E St Brunswick, MD 21716
Estimated Value: $265,578 - $348,000
Studio
1
Bath
1,104
Sq Ft
$262/Sq Ft
Est. Value
About This Home
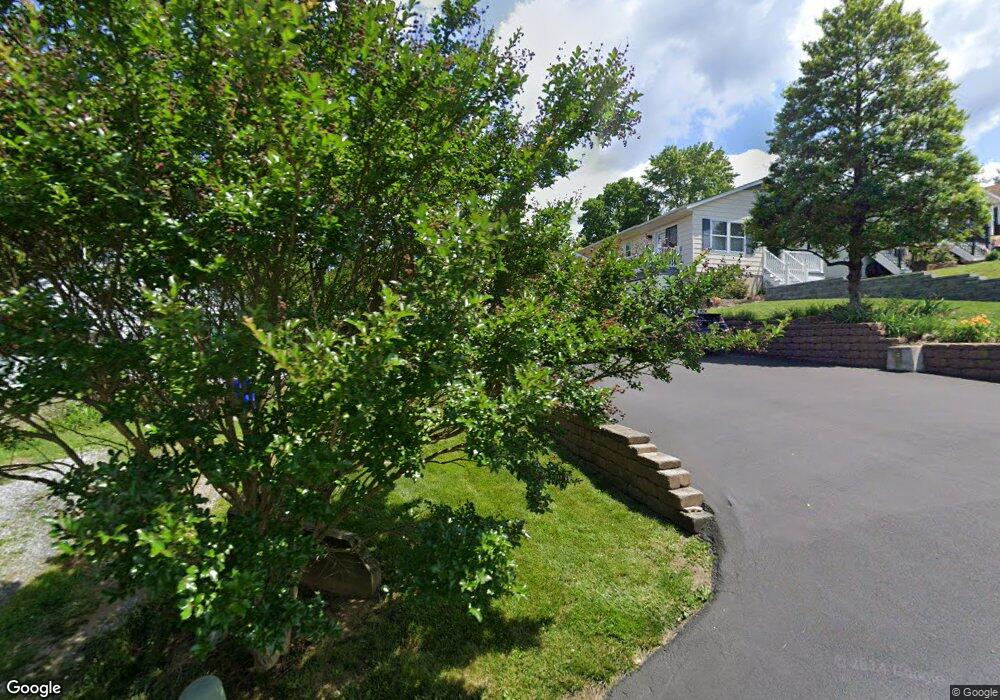
This home is located at 812 E E St, Brunswick, MD 21716 and is currently estimated at $288,895, approximately $261 per square foot. 812 E E St is a home located in Frederick County with nearby schools including Brunswick Elementary School, Brunswick Middle School, and Brunswick High School.
Ownership History
Date
Name
Owned For
Owner Type
Purchase Details
Closed on
Nov 15, 2023
Sold by
Minnick Mona Lisa
Bought by
Mona L Minnick Revocable Trust and Minnick
Current Estimated Value
Purchase Details
Closed on
Jun 14, 1996
Sold by
Minnick Melvin E and Minnick Rachel
Bought by
Minnick Mona Lisa
Purchase Details
Closed on
Sep 1, 1988
Sold by
Lewis Mark W
Bought by
Minnick Melvin E and Minnick Rachel
Home Financials for this Owner
Home Financials are based on the most recent Mortgage that was taken out on this home.
Original Mortgage
$75,000
Interest Rate
10.67%
Create a Home Valuation Report for This Property
The Home Valuation Report is an in-depth analysis detailing your home's value as well as a comparison with similar homes in the area
Home Values in the Area
Average Home Value in this Area
Purchase History
| Date | Buyer | Sale Price | Title Company |
|---|---|---|---|
| Mona L Minnick Revocable Trust | -- | None Listed On Document | |
| Mona L Minnick Revocable Trust | -- | None Listed On Document | |
| Minnick Mona Lisa | $85,000 | -- | |
| Minnick Melvin E | $75,000 | -- |
Source: Public Records
Mortgage History
| Date | Status | Borrower | Loan Amount |
|---|---|---|---|
| Previous Owner | Minnick Melvin E | $75,000 |
Source: Public Records
Tax History
| Year | Tax Paid | Tax Assessment Tax Assessment Total Assessment is a certain percentage of the fair market value that is determined by local assessors to be the total taxable value of land and additions on the property. | Land | Improvement |
|---|---|---|---|---|
| 2025 | $2,851 | $221,500 | -- | -- |
| 2024 | $2,851 | $209,800 | $85,200 | $124,600 |
| 2023 | $2,633 | $193,300 | $0 | $0 |
| 2022 | $2,503 | $176,800 | $0 | $0 |
| 2021 | $2,266 | $160,300 | $60,000 | $100,300 |
| 2020 | $2,266 | $148,767 | $0 | $0 |
| 2019 | $2,157 | $137,233 | $0 | $0 |
| 2018 | $2,089 | $125,700 | $43,100 | $82,600 |
| 2017 | $2,039 | $125,700 | $0 | $0 |
| 2016 | $2,271 | $120,767 | $0 | $0 |
| 2015 | $2,271 | $118,300 | $0 | $0 |
| 2014 | $2,271 | $118,300 | $0 | $0 |
Source: Public Records
Map
Nearby Homes
- 805 E B St
- 9 9th Ave
- 213 Wintergreen Ln
- 926 E A St
- 37 E C St
- 23 E F St
- 7 Afton Ct
- 0 E D St Unit MDFR2057714
- 519 N Maple Ave
- 8 S Maple Ave
- 7 W B St
- 11 W I St
- 21 W Orndorff Dr
- 15 N Maryland Ave
- 12 Evan Ct
- 8 N Virginia Ave
- 1602C New York Ave
- 126 Fiona Way
- TBB Shenandoah View Pkwy Unit ORCHID
- TBB Shenandoah View Pkwy Unit DAHLIA
Your Personal Tour Guide
Ask me questions while you tour the home.