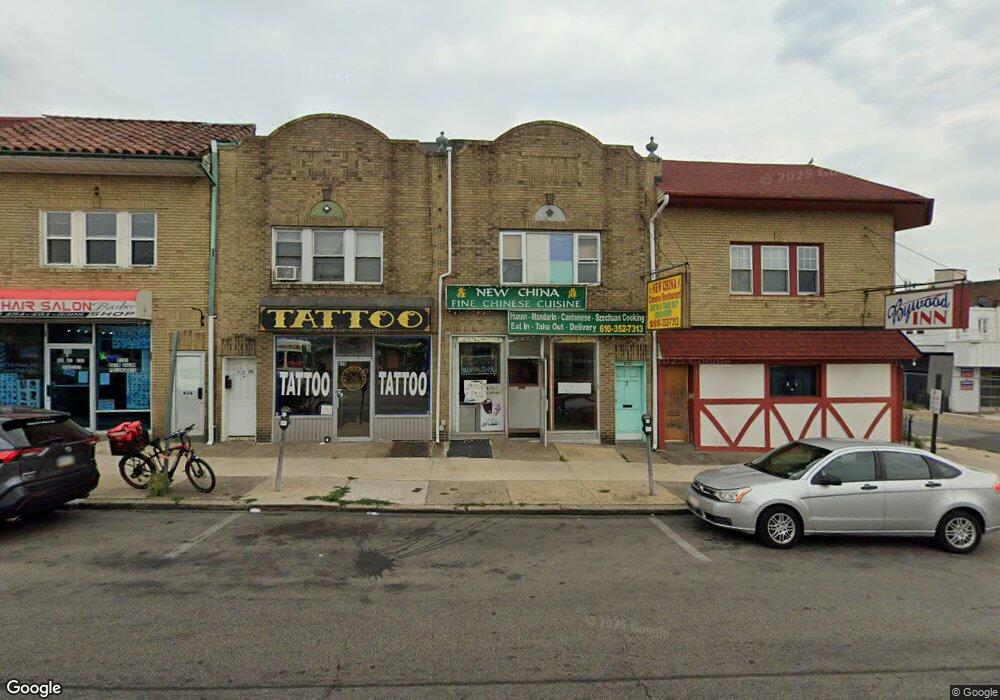
812 Garrett Rd Upper Darby, PA 19082
Estimated Value: $182,608
Studio
--
Bath
3,150
Sq Ft
$58/Sq Ft
Est. Value
About This Home
This home is located at 812 Garrett Rd, Upper Darby, PA 19082 and is currently estimated at $182,608, approximately $57 per square foot. 812 Garrett Rd is a home located in Delaware County with nearby schools including Bywood Elementary School, Upper Darby Kdg Center, and Upper Darby High School.
Ownership History
Date
Name
Owned For
Owner Type
Purchase Details
Closed on
Feb 21, 2017
Sold by
Chen Xue Zao
Bought by
Chen Xue Can
Current Estimated Value
Purchase Details
Closed on
Feb 19, 2009
Sold by
Chen Xue Can and Zheng Mei Qui
Bought by
Chen Xue Zao
Purchase Details
Closed on
Dec 5, 2005
Sold by
Dong Yi Ying and Chen Xue Can
Bought by
Chen Xue Can and Zheng Mei Qiu
Purchase Details
Closed on
Jan 23, 2002
Sold by
Tran Frank and Po Raymond
Bought by
Dong Yi Ying and Chen Xue Can
Create a Home Valuation Report for This Property
The Home Valuation Report is an in-depth analysis detailing your home's value as well as a comparison with similar homes in the area
Home Values in the Area
Average Home Value in this Area
Purchase History
| Date | Buyer | Sale Price | Title Company |
|---|---|---|---|
| Chen Xue Can | -- | None Available | |
| Chen Xue Zao | -- | None Available | |
| Chen Xue Can | -- | None Available | |
| Dong Yi Ying | $68,000 | -- |
Source: Public Records
Tax History
| Year | Tax Paid | Tax Assessment Tax Assessment Total Assessment is a certain percentage of the fair market value that is determined by local assessors to be the total taxable value of land and additions on the property. | Land | Improvement |
|---|---|---|---|---|
| 2025 | $6,150 | $145,420 | $28,230 | $117,190 |
| 2024 | $6,150 | $145,420 | $28,230 | $117,190 |
| 2023 | $6,092 | $145,420 | $28,230 | $117,190 |
| 2022 | $5,928 | $145,420 | $28,230 | $117,190 |
| 2021 | $7,993 | $145,420 | $28,230 | $117,190 |
| 2020 | $7,918 | $122,400 | $69,950 | $52,450 |
| 2019 | $7,779 | $122,400 | $69,950 | $52,450 |
| 2018 | $7,689 | $122,400 | $0 | $0 |
| 2017 | $7,489 | $122,400 | $0 | $0 |
| 2016 | $672 | $122,400 | $0 | $0 |
| 2015 | $685 | $122,400 | $0 | $0 |
| 2014 | $672 | $122,400 | $0 | $0 |
Source: Public Records
Map
Nearby Homes
- 329 Sanford Rd
- 367 Margate Rd
- 311 Margate Rd
- 305 Margate Rd
- 244 Wembly Rd
- 274 Avon Rd
- 319 Avon Rd
- 7281 Walnut St
- 212 Huntley Rd
- 512 Fairfield Ave
- 7283 Bradford Rd
- 234 Long Ln
- 7124 Pennsylvania Ave
- 232 Long Ln
- 537 Elm Ave
- 129 S Keystone Ave
- 360 Huntley Rd
- 1434 Bywood Ave
- 107 S Keystone Ave
- 232 Copley Rd
Your Personal Tour Guide
Ask me questions while you tour the home.