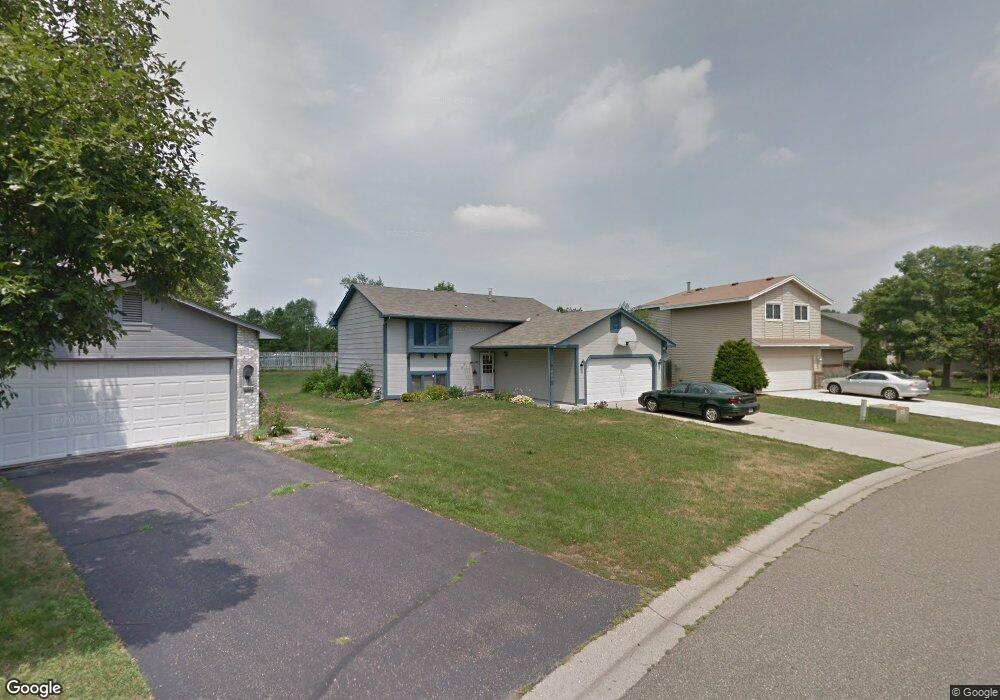
8125 Upper 145th St W Saint Paul, MN 55124
Redwood NeighborhoodEstimated Value: $397,374 - $407,000
4
Beds
2
Baths
2,120
Sq Ft
$189/Sq Ft
Est. Value
About This Home
This home is located at 8125 Upper 145th St W, Saint Paul, MN 55124 and is currently estimated at $401,344, approximately $189 per square foot. 8125 Upper 145th St W is a home located in Dakota County with nearby schools including Westview Elementary School, Valley Middle School, and Apple Valley Senior High School.
Ownership History
Date
Name
Owned For
Owner Type
Purchase Details
Closed on
Sep 29, 2020
Sold by
Khan Samiullah and Khan Rabia B
Bought by
Dilamo Tigist D and Legamo Tarekegn M
Current Estimated Value
Home Financials for this Owner
Home Financials are based on the most recent Mortgage that was taken out on this home.
Original Mortgage
$304,385
Outstanding Balance
$270,241
Interest Rate
2.8%
Mortgage Type
FHA
Estimated Equity
$131,103
Purchase Details
Closed on
Jan 30, 2008
Sold by
Manning Robert
Bought by
Khan Rabia B and Khan Samiullah
Home Financials for this Owner
Home Financials are based on the most recent Mortgage that was taken out on this home.
Original Mortgage
$240,000
Interest Rate
6.11%
Mortgage Type
New Conventional
Purchase Details
Closed on
May 4, 1998
Sold by
Jarvis Douglas S and Jarvis Ann M
Bought by
Manning Robert P and Manning Susan A
Create a Home Valuation Report for This Property
The Home Valuation Report is an in-depth analysis detailing your home's value as well as a comparison with similar homes in the area
Home Values in the Area
Average Home Value in this Area
Purchase History
| Date | Buyer | Sale Price | Title Company |
|---|---|---|---|
| Dilamo Tigist D | $310,000 | Gcs Title | |
| Khan Rabia B | $240,000 | -- | |
| Manning Robert P | $137,000 | -- | |
| Dilamo Tigist Tigist | $310,000 | -- |
Source: Public Records
Mortgage History
| Date | Status | Borrower | Loan Amount |
|---|---|---|---|
| Open | Dilamo Tigist D | $304,385 | |
| Previous Owner | Khan Rabia B | $240,000 | |
| Closed | Dilamo Tigist Tigist | $304,385 |
Source: Public Records
Tax History Compared to Growth
Tax History
| Year | Tax Paid | Tax Assessment Tax Assessment Total Assessment is a certain percentage of the fair market value that is determined by local assessors to be the total taxable value of land and additions on the property. | Land | Improvement |
|---|---|---|---|---|
| 2024 | $5,104 | $358,800 | $78,100 | $280,700 |
| 2023 | $5,104 | $365,500 | $78,200 | $287,300 |
| 2022 | $3,380 | $347,300 | $78,000 | $269,300 |
| 2021 | $3,252 | $297,700 | $67,800 | $229,900 |
| 2020 | $3,136 | $281,500 | $62,600 | $218,900 |
| 2019 | $2,953 | $264,800 | $59,600 | $205,200 |
| 2018 | $2,825 | $261,300 | $56,700 | $204,600 |
| 2017 | $2,695 | $241,200 | $54,000 | $187,200 |
| 2016 | $2,709 | $220,700 | $51,500 | $169,200 |
| 2015 | $2,524 | $201,906 | $46,381 | $155,525 |
| 2014 | -- | $189,153 | $44,260 | $144,893 |
| 2013 | -- | $170,950 | $40,187 | $130,763 |
Source: Public Records
Map
Nearby Homes
- 14350 Hickory Way
- 14208 Heritage Ln
- 14786 Hallmark Dr
- 441 Walnut Ln
- 14132 Heywood Path
- 14242 Glencove Trail
- 8681 144th Street Ct
- 13780 Hanover Way
- 14115 Pennock Ave Unit 301
- 7662 142nd St W
- 249 Elm Dr
- 13902 Herald Way
- 13910 Herald Ct
- 148 Spruce Dr
- 834 Fireside Dr
- 921 Cortland Dr S
- 13761 Hollybrook Cir
- 841 Cortland Dr
- 14709 White Oak Dr
- 13751 Hollybrook Cir
- 8111 Upper 145th St W
- 8135 Upper 145th St W
- 8099 Upper 145th St W
- 8143 Upper 145th St W
- 8118 Upper 145th St W
- 8134 Upper 145th St W
- 8157 Upper 145th St W
- 8087 Upper 145th St W
- 8153 Upper 145th St W
- 8102 Upper 145th St W
- 8146 Upper 145th St W
- 8088 Upper 145th St W
- 8073 Upper 145th St W
- 8154 Upper 145th St W
- 8076 Upper 145th St W
- 14627 Hanover Ln
- 14625 Hanover Ln
- 8059 Upper 145th St W
- 8159 Upper 145th St W
- 8175 Upper 145th St W