Estimated Value: $388,000 - $766,000
4
Beds
3
Baths
1,731
Sq Ft
$316/Sq Ft
Est. Value
About This Home
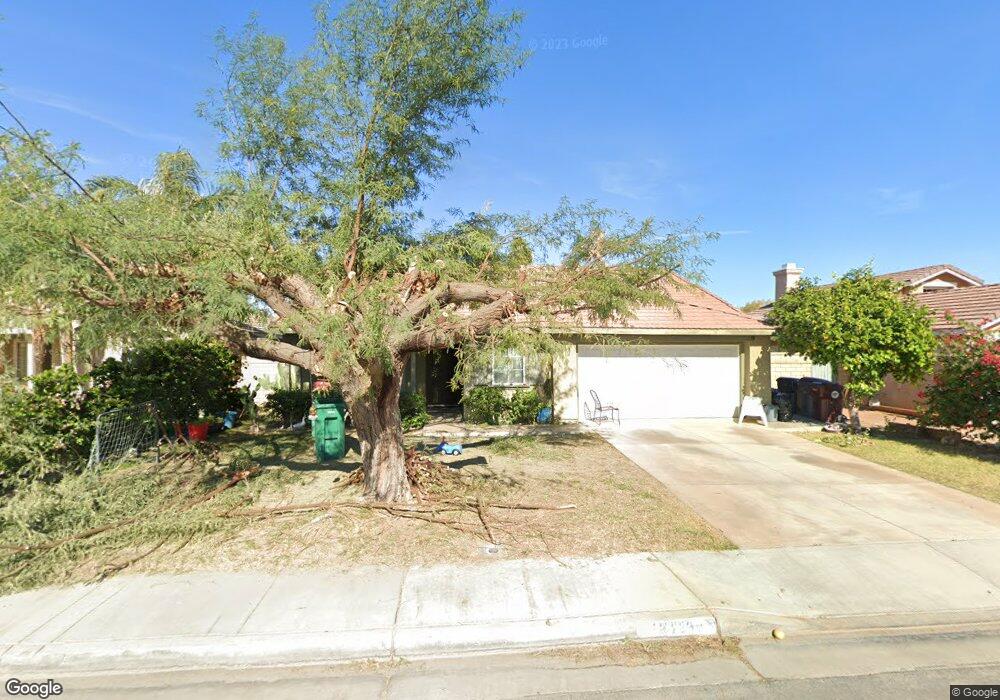
This home is located at 81280 Iris Ct, Indio, CA 92201 and is currently estimated at $547,793, approximately $316 per square foot. 81280 Iris Ct is a home located in Riverside County with nearby schools including Mountain Vista Elementary School, Cahuilla Desert Academy Junior High, and Coachella Valley High School.
Ownership History
Date
Name
Owned For
Owner Type
Purchase Details
Closed on
Dec 8, 2025
Sold by
Cervantes Francisca
Bought by
Francisca G Cervantes Revocable Trust and Cervantes
Current Estimated Value
Purchase Details
Closed on
Jul 15, 1999
Sold by
Hud
Bought by
Cervantes Francisco D and Cervantes Francisca
Home Financials for this Owner
Home Financials are based on the most recent Mortgage that was taken out on this home.
Original Mortgage
$99,387
Interest Rate
7.7%
Mortgage Type
FHA
Purchase Details
Closed on
Mar 12, 1999
Sold by
Norwest Mtg Inc
Bought by
Hud
Purchase Details
Closed on
Oct 23, 1998
Sold by
Flores David
Bought by
Norwest Mtg Inc
Purchase Details
Closed on
Apr 10, 1995
Sold by
Kaufman & Broad Of Southern Ca Inc
Bought by
Flores David
Home Financials for this Owner
Home Financials are based on the most recent Mortgage that was taken out on this home.
Original Mortgage
$125,102
Interest Rate
8.32%
Mortgage Type
FHA
Create a Home Valuation Report for This Property
The Home Valuation Report is an in-depth analysis detailing your home's value as well as a comparison with similar homes in the area
Home Values in the Area
Average Home Value in this Area
Purchase History
| Date | Buyer | Sale Price | Title Company |
|---|---|---|---|
| Francisca G Cervantes Revocable Trust | -- | None Listed On Document | |
| Cervantes Francisco D | -- | Commonwealth Land Title Co | |
| Hud | -- | Northern Counties Title | |
| Norwest Mtg Inc | $154,563 | Northern Counties Title | |
| Flores David | $126,500 | First American Title Ins Co |
Source: Public Records
Mortgage History
| Date | Status | Borrower | Loan Amount |
|---|---|---|---|
| Previous Owner | Cervantes Francisco D | $99,387 | |
| Previous Owner | Flores David | $125,102 |
Source: Public Records
Tax History
| Year | Tax Paid | Tax Assessment Tax Assessment Total Assessment is a certain percentage of the fair market value that is determined by local assessors to be the total taxable value of land and additions on the property. | Land | Improvement |
|---|---|---|---|---|
| 2025 | $3,212 | $150,594 | $30,724 | $119,870 |
| 2023 | $3,212 | $144,748 | $29,532 | $115,216 |
| 2022 | $2,933 | $141,910 | $28,953 | $112,957 |
| 2021 | $2,838 | $139,129 | $28,386 | $110,743 |
| 2020 | $2,549 | $137,703 | $28,095 | $109,608 |
| 2019 | $2,490 | $135,004 | $27,545 | $107,459 |
| 2018 | $2,434 | $132,357 | $27,006 | $105,351 |
| 2017 | $2,433 | $129,763 | $26,477 | $103,286 |
| 2016 | $2,372 | $127,219 | $25,958 | $101,261 |
| 2015 | $2,231 | $125,310 | $25,569 | $99,741 |
| 2014 | $2,190 | $122,857 | $25,069 | $97,788 |
Source: Public Records
Map
Nearby Homes
- 49233 Constitution Dr
- 49184 Tidewater Dr
- 48844 Meandering Cloud St
- 81109 Falling Leaf Ct
- 48820 Renewal St
- 81084 Falling Leaf Ct
- 48846 Stillwater St
- 48647 Renewal St
- 81620 Avenue 49 Unit 40a
- 81620 Avenue 49 Unit 66a
- 81620 Avenue 49 Unit 157
- 81620 Avenue 49 Unit 251b
- 81620 Avenue 49 Unit 118a
- 81620 Avenue 49 Unit 1A
- 81620 Avenue 49 Unit 276b
- 81620 Avenue 49 Unit 8a
- 81620 Avenue 49 Unit 231b
- 81620 Avenue 49 Unit 97a
- 81620 Avenue 49 Unit 146
- 81620 Avenue 49 Unit 261B
- 81268 Iris Ct
- 81290 Iris Ct
- 81281 Begonia Ct
- 81256 Iris Ct
- 81269 Begonia Ct
- 81291 Begonia Ct
- 81281 Iris Ct
- 81257 Begonia Ct
- 81269 Iris Ct
- 81291 Iris Ct
- 81244 Iris Ct
- 81257 Iris Ct
- 81245 Begonia Ct
- 49258 Violet St
- 49232 Violet St
- 49284 Violet St
- 49206 Violet St
- 81245 Iris Ct
- 81230 Iris Ct
- 49312 Violet St
Your Personal Tour Guide
Ask me questions while you tour the home.