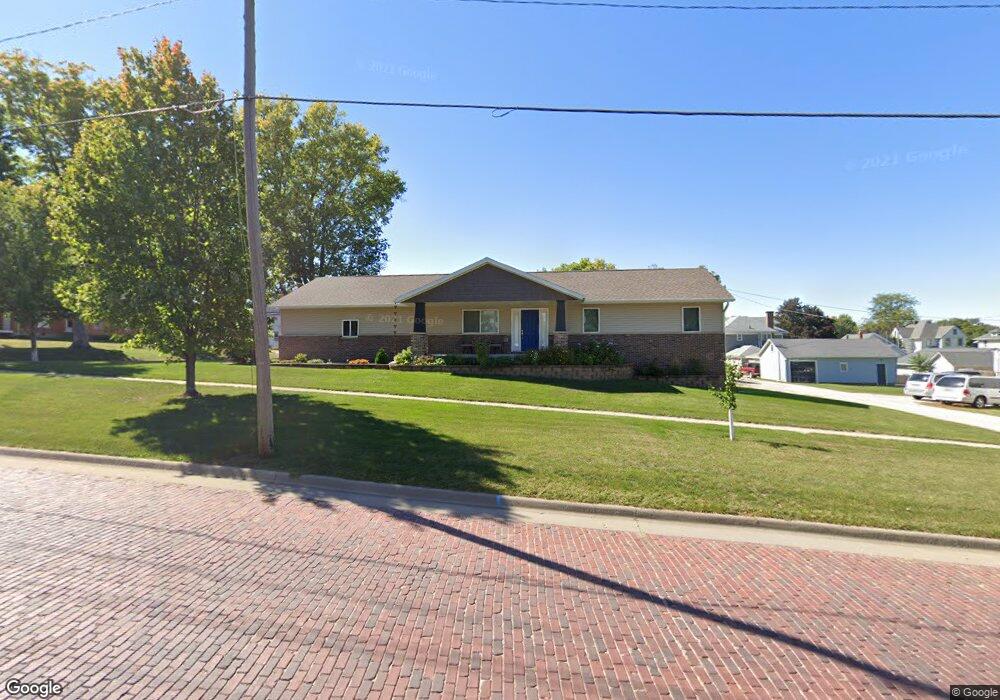
813 2nd Ave Vinton, IA 52349
Estimated Value: $178,000 - $386,395
4
Beds
3
Baths
2,128
Sq Ft
$150/Sq Ft
Est. Value
About This Home
This home is located at 813 2nd Ave, Vinton, IA 52349 and is currently estimated at $319,349, approximately $150 per square foot. 813 2nd Ave is a home located in Benton County with nearby schools including Tilford Elementary School, Shellsburg Elementary School, and Vinton-Shellsburg Middle School.
Ownership History
Date
Name
Owned For
Owner Type
Purchase Details
Closed on
Apr 16, 2016
Sold by
Bolin Dustin L and Bolin Markie A
Bought by
Albertsen Caleb L and Albertsen Megan R
Current Estimated Value
Home Financials for this Owner
Home Financials are based on the most recent Mortgage that was taken out on this home.
Original Mortgage
$172,000
Outstanding Balance
$136,778
Interest Rate
3.71%
Mortgage Type
Closed End Mortgage
Estimated Equity
$182,571
Purchase Details
Closed on
May 29, 2011
Sold by
Owens William T and Owens Beth H
Bought by
Bolin Dustin L and Bolin Markie A
Home Financials for this Owner
Home Financials are based on the most recent Mortgage that was taken out on this home.
Original Mortgage
$24,000
Interest Rate
5%
Mortgage Type
Adjustable Rate Mortgage/ARM
Create a Home Valuation Report for This Property
The Home Valuation Report is an in-depth analysis detailing your home's value as well as a comparison with similar homes in the area
Home Values in the Area
Average Home Value in this Area
Purchase History
| Date | Buyer | Sale Price | Title Company |
|---|---|---|---|
| Albertsen Caleb L | -- | None Available | |
| Bolin Dustin L | $30,000 | -- |
Source: Public Records
Mortgage History
| Date | Status | Borrower | Loan Amount |
|---|---|---|---|
| Open | Albertsen Caleb L | $172,000 | |
| Previous Owner | Bolin Dustin L | $24,000 |
Source: Public Records
Tax History Compared to Growth
Tax History
| Year | Tax Paid | Tax Assessment Tax Assessment Total Assessment is a certain percentage of the fair market value that is determined by local assessors to be the total taxable value of land and additions on the property. | Land | Improvement |
|---|---|---|---|---|
| 2025 | $6,494 | $387,900 | $26,200 | $361,700 |
| 2024 | $6,494 | $356,800 | $25,100 | $331,700 |
| 2023 | $4,790 | $356,800 | $25,100 | $331,700 |
| 2022 | $4,916 | $231,500 | $20,100 | $211,400 |
| 2021 | $4,916 | $231,500 | $20,100 | $211,400 |
| 2020 | $4,434 | $213,700 | $27,300 | $186,400 |
| 2019 | $4,434 | $213,700 | $27,300 | $186,400 |
| 2018 | $4,304 | $210,800 | $26,500 | $184,300 |
| 2017 | $4,134 | $210,800 | $26,500 | $184,300 |
| 2016 | $4,064 | $197,000 | $24,800 | $172,200 |
| 2015 | $4,064 | $197,000 | $24,800 | $172,200 |
| 2014 | $3,776 | $183,300 | $0 | $0 |
Source: Public Records
Map
Nearby Homes