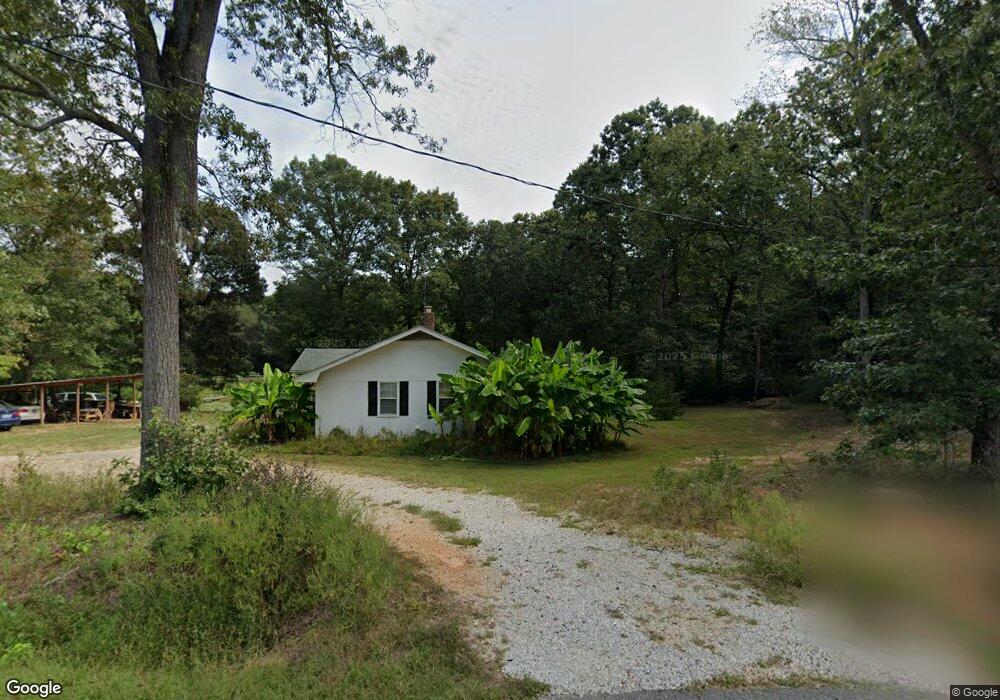
813 Georgetown Dr Winder, GA 30680
Estimated Value: $353,323 - $499,000
3
Beds
2
Baths
1,568
Sq Ft
$263/Sq Ft
Est. Value
About This Home
This home is located at 813 Georgetown Dr, Winder, GA 30680 and is currently estimated at $412,331, approximately $262 per square foot. 813 Georgetown Dr is a home located in Barrow County with nearby schools including Bramlett Elementary School, Russell Middle School, and Winder-Barrow High School.
Ownership History
Date
Name
Owned For
Owner Type
Purchase Details
Closed on
Aug 5, 2008
Sold by
Wentworth Dorothea
Bought by
Thao Vue and Thao Yer
Current Estimated Value
Home Financials for this Owner
Home Financials are based on the most recent Mortgage that was taken out on this home.
Original Mortgage
$206,040
Outstanding Balance
$133,389
Interest Rate
6.31%
Mortgage Type
New Conventional
Estimated Equity
$278,942
Purchase Details
Closed on
Apr 23, 2008
Sold by
An Alden Thomas L Sr
Bought by
Alden Dorthea W
Purchase Details
Closed on
Mar 26, 2002
Sold by
Elias Roann and Elias Michael
Bought by
Alden Thomas L and Alden Dorothea W
Home Financials for this Owner
Home Financials are based on the most recent Mortgage that was taken out on this home.
Original Mortgage
$164,650
Interest Rate
6.8%
Mortgage Type
New Conventional
Purchase Details
Closed on
Oct 11, 1988
Bought by
Elias Michael and Elias Roan
Create a Home Valuation Report for This Property
The Home Valuation Report is an in-depth analysis detailing your home's value as well as a comparison with similar homes in the area
Home Values in the Area
Average Home Value in this Area
Purchase History
| Date | Buyer | Sale Price | Title Company |
|---|---|---|---|
| Thao Vue | $202,000 | -- | |
| Alden Dorthea W | -- | -- | |
| Alden Thomas L | $205,900 | -- | |
| Elias Michael | $72,000 | -- |
Source: Public Records
Mortgage History
| Date | Status | Borrower | Loan Amount |
|---|---|---|---|
| Open | Thao Vue | $206,040 | |
| Previous Owner | Alden Thomas L | $164,650 |
Source: Public Records
Tax History
| Year | Tax Paid | Tax Assessment Tax Assessment Total Assessment is a certain percentage of the fair market value that is determined by local assessors to be the total taxable value of land and additions on the property. | Land | Improvement |
|---|---|---|---|---|
| 2025 | $2,380 | $101,954 | $42,326 | $59,628 |
| 2024 | $2,400 | $100,307 | $42,326 | $57,981 |
| 2023 | $1,977 | $100,307 | $42,326 | $57,981 |
| 2022 | $2,156 | $78,595 | $42,326 | $36,269 |
| 2021 | $1,934 | $67,147 | $33,861 | $33,286 |
| 2020 | $1,525 | $53,383 | $23,079 | $30,304 |
| 2019 | $1,551 | $53,383 | $23,079 | $30,304 |
| 2018 | $1,528 | $53,383 | $23,079 | $30,304 |
| 2017 | $1,429 | $49,095 | $23,079 | $26,016 |
| 2016 | $1,368 | $49,095 | $23,079 | $26,016 |
| 2015 | $1,374 | $49,095 | $23,079 | $26,016 |
| 2014 | $1,023 | $37,325 | $11,309 | $26,016 |
| 2013 | -- | $35,537 | $11,308 | $24,228 |
Source: Public Records
Map
Nearby Homes
- 817 Brookside Dr
- 1929 Windstone Place
- 912 Westwood Ln
- 103 Treemont Way
- 1224 Treemont Trace
- 1303 Windstone Ct
- 681 County Line Auburn Rd
- 604 Fox Run
- 1000 Jim Johnson Rd
- 903 Carl Bramlett Rd
- 807 Kenwood Ln
- 629 Dee Kennedy Rd
- 432 Mulberry Rd
- 687 Ansley Ct
- 262 Blake Ln
- 1136 Lexington Ridge Rd
- 222 Loon Lake Way
- 168 Warrior Ct
- 1022 Cyperts Trail
- 226 Coffee Ln
- 812 Georgetown Dr
- 810 Georgetown Dr
- 808 Georgetown Dr Unit 2
- 819 Georgetown Dr Unit 70
- 819 Georgetown Dr Unit 1
- 819 Georgetown Dr
- 806 Georgetown Dr Unit 2
- 805 Doster Cir
- 804 Georgetown Dr Unit 2
- 789 Doster Cir
- 822 Georgetown Dr Unit 1
- 802 Georgetown Dr
- 807 Doster Cir
- 824 Georgetown Dr Unit 1
- 823 Georgetown Dr Unit 1
- 815 Mulberry Rd
- 775 Mulberry Rd
- 779 Mulberry Rd
- 767 Mulberry Rd
- 800 Georgetown Dr Unit 2
Your Personal Tour Guide
Ask me questions while you tour the home.