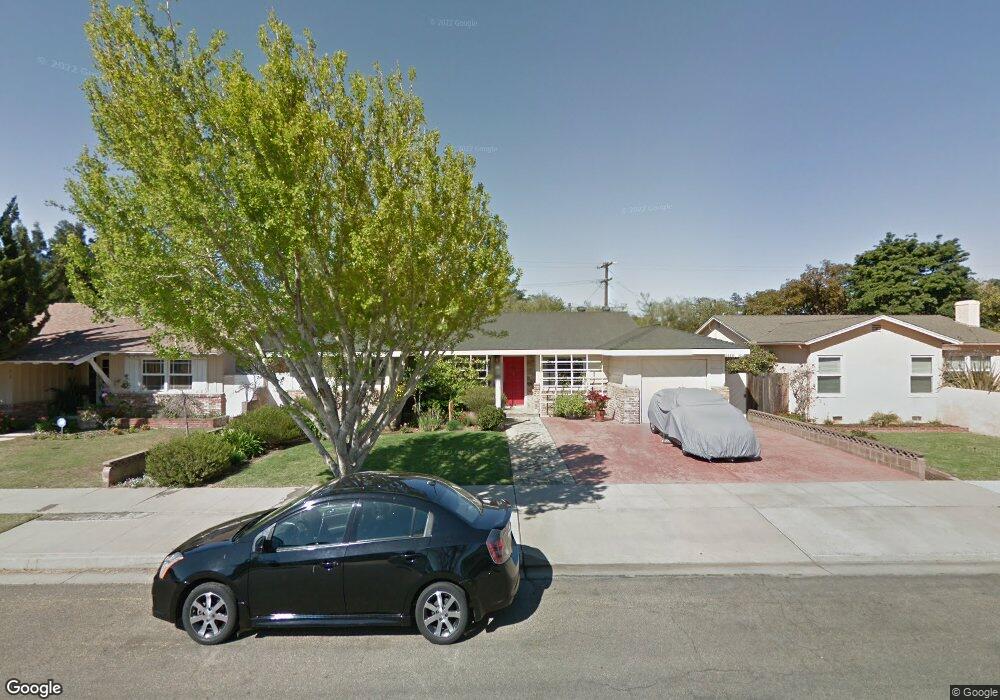
813 Haslam Dr Santa Maria, CA 93454
Santa Maria East NeighborhoodEstimated Value: $694,061
3
Beds
3
Baths
1,800
Sq Ft
$386/Sq Ft
Est. Value
About This Home
This home is located at 813 Haslam Dr, Santa Maria, CA 93454 and is currently estimated at $694,061, approximately $385 per square foot. 813 Haslam Dr is a home located in Santa Barbara County with nearby schools including Miller (Isaac) Elementary School, Fesler (Isaac) Junior High School, and Santa Maria High School.
Ownership History
Date
Name
Owned For
Owner Type
Purchase Details
Closed on
Jun 3, 2003
Sold by
Valenta Joseph A
Bought by
The Joseph A Valenta Ca Family Living Tr and Valenta Joseph A
Current Estimated Value
Purchase Details
Closed on
Dec 10, 1998
Sold by
Yvonne Severietti Marie and Koonce Joel M
Bought by
Valenta Joseph A
Home Financials for this Owner
Home Financials are based on the most recent Mortgage that was taken out on this home.
Original Mortgage
$127,920
Outstanding Balance
$28,681
Interest Rate
6.63%
Mortgage Type
Commercial
Estimated Equity
$665,380
Create a Home Valuation Report for This Property
The Home Valuation Report is an in-depth analysis detailing your home's value as well as a comparison with similar homes in the area
Home Values in the Area
Average Home Value in this Area
Purchase History
| Date | Buyer | Sale Price | Title Company |
|---|---|---|---|
| The Joseph A Valenta Ca Family Living Tr | -- | -- | |
| Valenta Joseph A | $160,000 | Lawyers Title Company |
Source: Public Records
Mortgage History
| Date | Status | Borrower | Loan Amount |
|---|---|---|---|
| Open | Valenta Joseph A | $127,920 |
Source: Public Records
Tax History Compared to Growth
Tax History
| Year | Tax Paid | Tax Assessment Tax Assessment Total Assessment is a certain percentage of the fair market value that is determined by local assessors to be the total taxable value of land and additions on the property. | Land | Improvement |
|---|---|---|---|---|
| 2025 | $2,736 | $250,020 | $86,208 | $163,812 |
| 2023 | $2,736 | $240,312 | $82,861 | $157,451 |
| 2022 | $2,643 | $235,601 | $81,237 | $154,364 |
| 2021 | $2,572 | $230,983 | $79,645 | $151,338 |
| 2020 | $2,568 | $228,616 | $78,829 | $149,787 |
| 2019 | $2,539 | $224,134 | $77,284 | $146,850 |
| 2018 | $2,507 | $219,740 | $75,769 | $143,971 |
| 2017 | $2,478 | $215,433 | $74,284 | $141,149 |
| 2016 | $2,371 | $211,210 | $72,828 | $138,382 |
| 2014 | $2,228 | $203,964 | $70,330 | $133,634 |
Source: Public Records
Map
Nearby Homes
- 413 E Park Ave Unit C3
- 441 Chaparral St
- 623 E Cook St
- 610 S Smith St
- 828 E Boone St Unit 12
- 700 W Morrison Ave
- 715 S Bradley Rd Unit 14
- 295 N Broadway Unit 184
- 1550 Lark St
- 117 W Fesler St Unit A,B,C,D,E
- 226 E Tunnell St
- 1725 Colorado St
- 1139 S Western Ave
- 1701 S Thornburg St
- 1701 S Thornburg St Unit 143
- 1701 S Thornburg St Unit 75
- 1224 Jackie Ln
- 1837 Olive Dr
- 321 Inger Dr Unit G55
- 420 N Railroad Ave