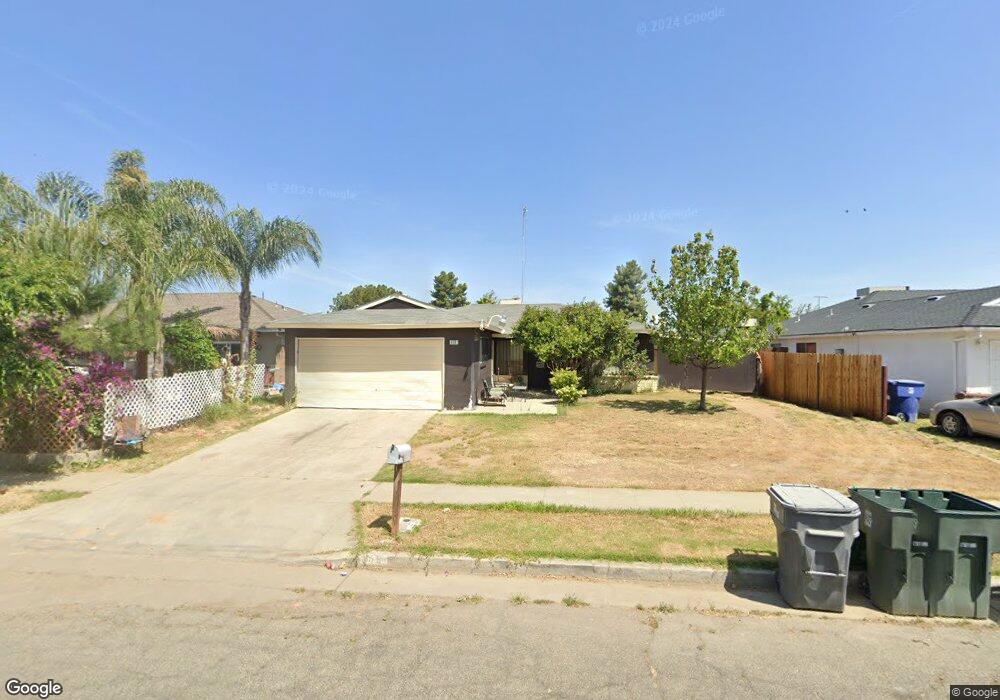
813 James Way Madera, CA 93638
North Madera NeighborhoodEstimated Value: $285,000 - $297,095
3
Beds
2
Baths
1,040
Sq Ft
$280/Sq Ft
Est. Value
About This Home
This home is located at 813 James Way, Madera, CA 93638 and is currently estimated at $291,274, approximately $280 per square foot. 813 James Way is a home located in Madera County with nearby schools including James Monroe Elementary School, Jack G. Desmond Middle School, and Madera South High School.
Ownership History
Date
Name
Owned For
Owner Type
Purchase Details
Closed on
Aug 2, 2001
Sold by
Quinonez Anthony J and Quinonez Margarita H
Bought by
Alduenda Luis V and Alduenda Olga M
Current Estimated Value
Home Financials for this Owner
Home Financials are based on the most recent Mortgage that was taken out on this home.
Original Mortgage
$72,000
Interest Rate
6.43%
Purchase Details
Closed on
Mar 9, 1999
Sold by
Hud
Bought by
Quinonez Anthony J and Quinonez Margarita H
Home Financials for this Owner
Home Financials are based on the most recent Mortgage that was taken out on this home.
Original Mortgage
$57,950
Interest Rate
7.04%
Purchase Details
Closed on
Feb 2, 1999
Sold by
Marin Amaya Samuel and Marin Jose
Bought by
Norwest Mtg Inc
Home Financials for this Owner
Home Financials are based on the most recent Mortgage that was taken out on this home.
Original Mortgage
$57,950
Interest Rate
7.04%
Purchase Details
Closed on
Jan 15, 1998
Sold by
Norwest Mtg Inc
Bought by
Hud
Create a Home Valuation Report for This Property
The Home Valuation Report is an in-depth analysis detailing your home's value as well as a comparison with similar homes in the area
Home Values in the Area
Average Home Value in this Area
Purchase History
| Date | Buyer | Sale Price | Title Company |
|---|---|---|---|
| Alduenda Luis V | $90,000 | Chicago Title Co | |
| Quinonez Anthony J | $61,000 | Commonwealth Title | |
| Norwest Mtg Inc | $77,562 | Fidelity National Title Co | |
| Hud | -- | Fidelity National Title Ins |
Source: Public Records
Mortgage History
| Date | Status | Borrower | Loan Amount |
|---|---|---|---|
| Previous Owner | Alduenda Luis V | $72,000 | |
| Previous Owner | Quinonez Anthony J | $57,950 |
Source: Public Records
Tax History
| Year | Tax Paid | Tax Assessment Tax Assessment Total Assessment is a certain percentage of the fair market value that is determined by local assessors to be the total taxable value of land and additions on the property. | Land | Improvement |
|---|---|---|---|---|
| 2025 | $1,502 | $130,327 | $26,059 | $104,268 |
| 2023 | $1,502 | $125,269 | $25,049 | $100,220 |
| 2022 | $1,403 | $122,813 | $24,558 | $98,255 |
| 2021 | $1,377 | $120,406 | $24,077 | $96,329 |
| 2020 | $1,358 | $115,446 | $23,091 | $92,355 |
| 2019 | $1,335 | $112,083 | $22,418 | $89,665 |
| 2018 | $1,195 | $106,745 | $21,350 | $85,395 |
| 2017 | $1,148 | $101,662 | $20,333 | $81,329 |
| 2016 | $1,119 | $99,668 | $19,934 | $79,734 |
| 2015 | $1,078 | $94,922 | $18,985 | $75,937 |
| 2014 | $942 | $87,084 | $17,417 | $69,667 |
Source: Public Records
Map
Nearby Homes
- 800 Wessmith Way
- 0 E Cleveland Unit 642871
- 1105 Austin St
- 363 E Rush St
- 930 Sierra St
- 1218 E Cleveland Ave Unit 2
- 1218 E Cleveland Ave Unit 114
- 1218 E Cleveland Ave Unit 153
- 1218 E Cleveland Ave Unit 86
- 1218 E Cleveland Ave Unit 152
- 1218 E Cleveland Ave Unit 19
- 1218 E Cleveland Ave Unit 103
- 1218 E Cleveland Ave Unit 98
- 1218 E Cleveland Ave Unit 23
- 1218 E Cleveland Ave Unit 30
- 27592 Avenue 16
- 817 Sierra St
- 27594 Avenue 16
- 820 Columbia St
- 29630 California 145
Your Personal Tour Guide
Ask me questions while you tour the home.