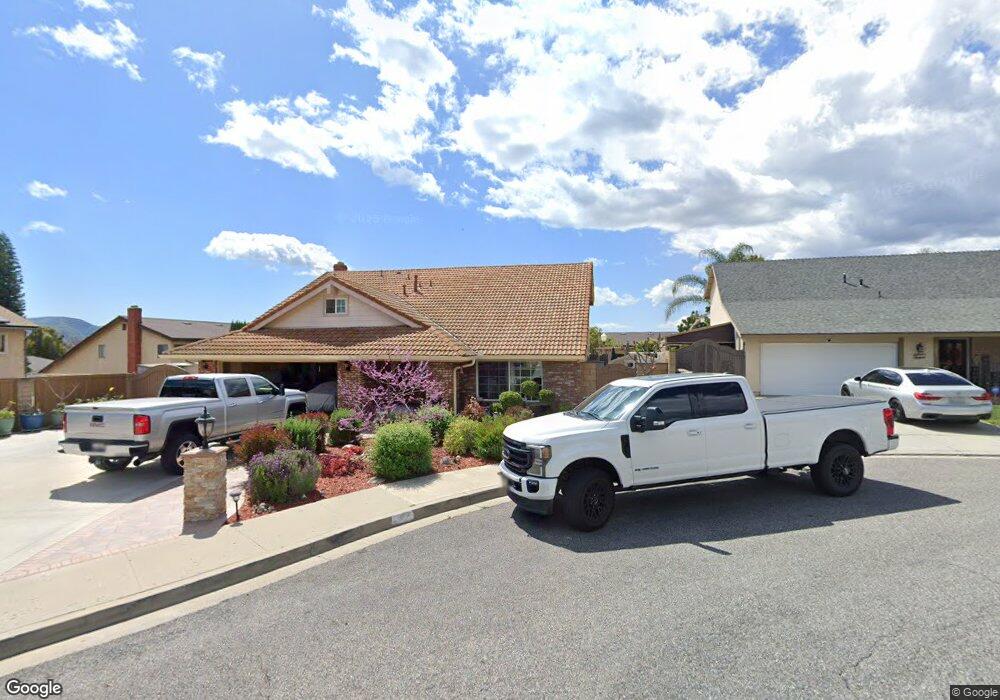
813 Mesa Dr Fillmore, CA 93015
Estimated Value: $783,000 - $845,000
4
Beds
3
Baths
2,313
Sq Ft
$352/Sq Ft
Est. Value
About This Home
This home is located at 813 Mesa Dr, Fillmore, CA 93015 and is currently estimated at $813,873, approximately $351 per square foot. 813 Mesa Dr is a home located in Ventura County with nearby schools including San Cayetano Elementary School and Fillmore Senior High.
Ownership History
Date
Name
Owned For
Owner Type
Purchase Details
Closed on
Mar 13, 2003
Sold by
Luna Rosie P and Preciado Rosie
Bought by
Luna Frank S and Luna Rosie P
Current Estimated Value
Purchase Details
Closed on
Feb 1, 2000
Sold by
Ybarra Edward S
Bought by
Ybarra Les Andrew
Purchase Details
Closed on
Oct 8, 1993
Sold by
Ybarra Timothy E and Ybarra Suzanne
Bought by
Preciado Rosie
Home Financials for this Owner
Home Financials are based on the most recent Mortgage that was taken out on this home.
Original Mortgage
$124,500
Interest Rate
6.91%
Create a Home Valuation Report for This Property
The Home Valuation Report is an in-depth analysis detailing your home's value as well as a comparison with similar homes in the area
Home Values in the Area
Average Home Value in this Area
Purchase History
| Date | Buyer | Sale Price | Title Company |
|---|---|---|---|
| Luna Frank S | -- | -- | |
| Ybarra Les Andrew | -- | -- | |
| Preciado Rosie | -- | Fidelity National Title |
Source: Public Records
Mortgage History
| Date | Status | Borrower | Loan Amount |
|---|---|---|---|
| Previous Owner | Preciado Rosie | $124,500 |
Source: Public Records
Tax History
| Year | Tax Paid | Tax Assessment Tax Assessment Total Assessment is a certain percentage of the fair market value that is determined by local assessors to be the total taxable value of land and additions on the property. | Land | Improvement |
|---|---|---|---|---|
| 2025 | $3,989 | $365,673 | $137,953 | $227,720 |
| 2024 | $3,989 | $358,503 | $135,248 | $223,255 |
| 2023 | $3,934 | $351,474 | $132,596 | $218,878 |
| 2022 | $3,636 | $344,583 | $129,996 | $214,587 |
| 2021 | $4,133 | $337,827 | $127,447 | $210,380 |
| 2020 | $3,833 | $334,365 | $126,141 | $208,224 |
| 2019 | $3,624 | $309,182 | $123,668 | $185,514 |
| 2018 | $3,550 | $303,121 | $121,244 | $181,877 |
| 2017 | $3,569 | $297,178 | $118,867 | $178,311 |
| 2016 | $3,303 | $291,352 | $116,537 | $174,815 |
| 2015 | $3,210 | $286,978 | $114,788 | $172,190 |
| 2014 | $3,207 | $281,359 | $112,541 | $168,818 |
Source: Public Records
Map
Nearby Homes
- 345 Blaine Ave
- 809 Woodgrove Rd
- 815 Woodgrove Rd
- 639 Mountain View St
- 318 Bard St
- 616 Island View St
- 831 Blaine Ave
- 404 Central Ave
- 340 Central Ave
- 949 Blaine Ave
- 252 Driftwood St
- 1560 Goodenough Rd
- 600 C St
- 199 Rosewood St
- 81 Wildwood Ln
- 578 Apricot Ln
- 458 Edgewood Dr
- 513 Heritage Valley Pkwy
- 549 Heritage Valley Pkwy
- 1106 Mockingbird Ln
Your Personal Tour Guide
Ask me questions while you tour the home.