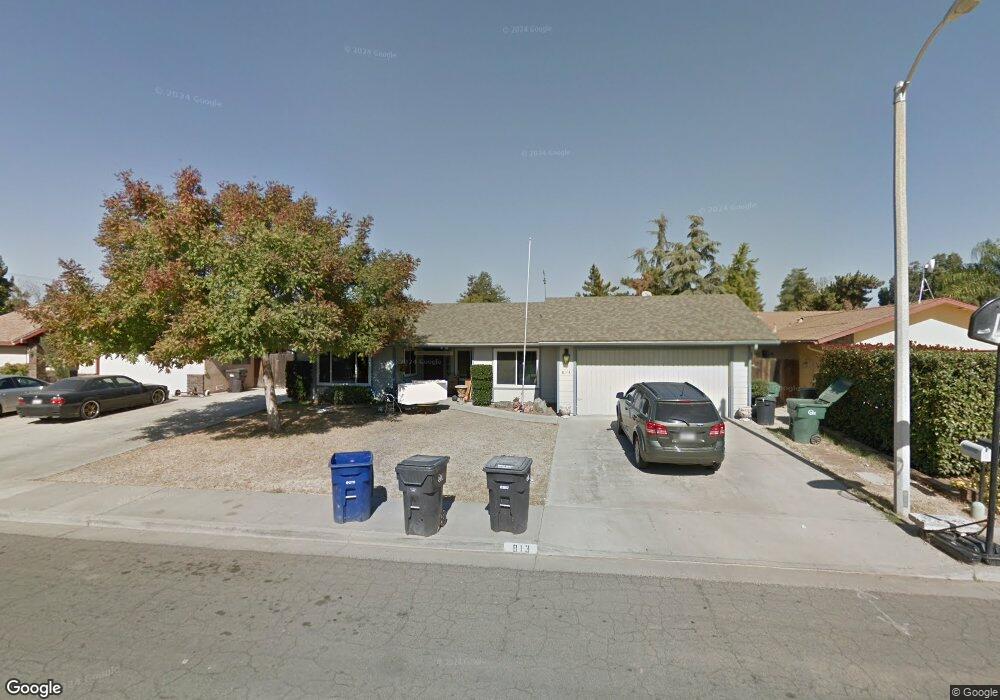
813 Woods Place Exeter, CA 93221
Estimated Value: $385,000 - $461,000
4
Beds
2
Baths
1,950
Sq Ft
$215/Sq Ft
Est. Value
About This Home
This home is located at 813 Woods Place, Exeter, CA 93221 and is currently estimated at $419,743, approximately $215 per square foot. 813 Woods Place is a home located in Tulare County.
Ownership History
Date
Name
Owned For
Owner Type
Purchase Details
Closed on
Dec 6, 2019
Sold by
Johns Debbie
Bought by
Johns Josh and Perez Mireya
Current Estimated Value
Purchase Details
Closed on
Jul 29, 2003
Sold by
Johns John D
Bought by
Johns Debbie
Home Financials for this Owner
Home Financials are based on the most recent Mortgage that was taken out on this home.
Original Mortgage
$171,000
Outstanding Balance
$72,865
Interest Rate
5.29%
Mortgage Type
Purchase Money Mortgage
Estimated Equity
$346,878
Purchase Details
Closed on
Jul 22, 2003
Sold by
Kluck Roweton Dixie C
Bought by
Johns Debbie
Home Financials for this Owner
Home Financials are based on the most recent Mortgage that was taken out on this home.
Original Mortgage
$171,000
Outstanding Balance
$72,865
Interest Rate
5.29%
Mortgage Type
Purchase Money Mortgage
Estimated Equity
$346,878
Purchase Details
Closed on
Dec 18, 2000
Sold by
Terry L Eileen
Bought by
Roweton Estel L and Kluck Roweton Dixie C
Purchase Details
Closed on
May 20, 1996
Sold by
Terry L Eileen
Bought by
Terry L Eileen
Create a Home Valuation Report for This Property
The Home Valuation Report is an in-depth analysis detailing your home's value as well as a comparison with similar homes in the area
Home Values in the Area
Average Home Value in this Area
Purchase History
| Date | Buyer | Sale Price | Title Company |
|---|---|---|---|
| Johns Josh | -- | None Available | |
| Johns Debbie | -- | Cuesta Title | |
| Johns Debbie | $180,000 | Cuesta Title | |
| Roweton Estel L | $125,000 | Chicago Title Co | |
| Terry L Eileen | -- | -- |
Source: Public Records
Mortgage History
| Date | Status | Borrower | Loan Amount |
|---|---|---|---|
| Open | Johns Debbie | $171,000 |
Source: Public Records
Tax History
| Year | Tax Paid | Tax Assessment Tax Assessment Total Assessment is a certain percentage of the fair market value that is determined by local assessors to be the total taxable value of land and additions on the property. | Land | Improvement |
|---|---|---|---|---|
| 2025 | $2,721 | $255,920 | $49,759 | $206,161 |
| 2024 | $2,721 | $250,903 | $48,784 | $202,119 |
| 2023 | $2,649 | $245,984 | $47,828 | $198,156 |
| 2022 | $2,594 | $241,162 | $46,891 | $194,271 |
| 2021 | $2,572 | $236,434 | $45,972 | $190,462 |
| 2020 | $2,549 | $234,010 | $45,501 | $188,509 |
| 2019 | $2,465 | $229,422 | $44,609 | $184,813 |
| 2018 | $2,360 | $224,923 | $43,734 | $181,189 |
| 2017 | $2,326 | $220,512 | $42,876 | $177,636 |
| 2016 | $2,243 | $216,188 | $42,035 | $174,153 |
| 2015 | $2,219 | $212,941 | $41,404 | $171,537 |
| 2014 | $2,219 | $208,770 | $40,593 | $168,177 |
Source: Public Records
Map
Nearby Homes
- 812 Woods Place
- 1161 N Belmont Rd
- 314 N Albert Ave Unit 132
- 314 N Albert Ave Unit 39
- 314 N Albert Ave Unit 1
- 314 N Albert Ave Unit 42
- 314 N Albert Ave Unit 73
- 314 N Albert Ave Unit 101
- 314 N Albert Ave Unit 80
- 570 Little Ln
- 606 N Orange Ave
- 1370 Meadow Ave
- 307 N Orange Ave
- 0 N Belmont Rd
- 107 Ruth St
- 137 N H St
- 457 W Maple St
- 447 W Maple St
- 264 S Orange Ave
- 210 Sequoia Dr
Your Personal Tour Guide
Ask me questions while you tour the home.